Filter
Resources
Classroom Resources
Lesson Plan:
Students solve word problems and use packing peanuts to visualize how much CO2 is produced...

Students participate in two physical, noncompetitive games that illustrate the challenges that arise when working...
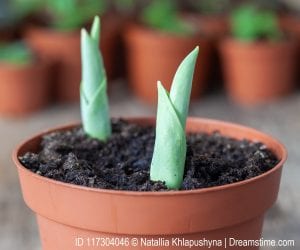
A simulation and gardening lab that gives students hands-on experience with the effects of increasing...

Students calculate the rate of natural increase and corresponding doubling time or half-life for several...

In small groups, students explore changes in regional fertility rates and life expectancy trends over...
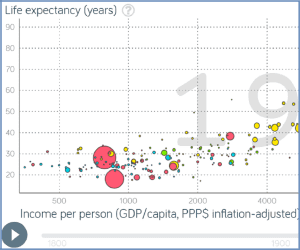
Using the 'trendalyzer' program from www.gapminder.org, students construct and interpret dynamic graphs and discuss differences...

Students use mathematical formulas to calculate growth rates and doubling times, and to determine the...
Students listen to a mathematical folktale and then solve word problems related to doubling. Students...

Students observe and collect data on the exponential growth of yeast cultures in both a...
Reading:
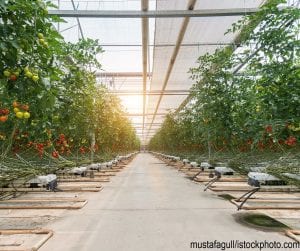
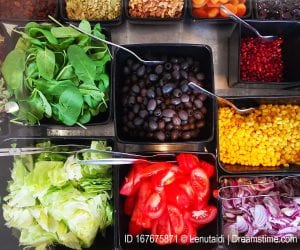
Food and Agriculture background reading: Feeding an expanding global population and battling malnutrition among the...
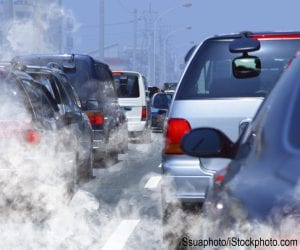
Air pollution background reading: An overview of how fossil fuel combustion creates unhealthful levels of...
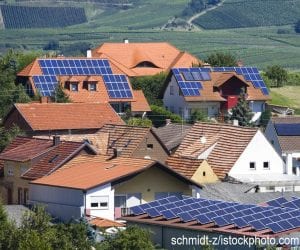
Energy case study reading: A profile of how Germany came to lead the world in...
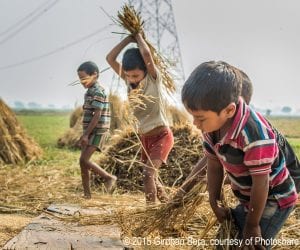
Our global family background reading: There are vast differences in wealth, energy use, health, and...

An elementary-level reading on the creation and disposal of solid waste.

An elementary-level reading that addresses renewable and non-renewable resources.
An elementary-level reading that discusses population growth trends for wildlife and people.

Human population, now over 7 billion, cannot continue to grow indefinitely. There are limits to...
Lesson Packet:

Thematic unit for the high school classroom covers issues around personal consumption and consumerism. Includes...

Thematic unit for the middle school classroom on basic population dynamics. Understanding demographics is foundational...
Thematic unit for the high school classroom covers the basics of population growth and demographics...
Population Lesson Plans for NCERT Science and Geography is a set of lesson plans for...

Thematic unit for the high school classroom explores economic issues in the US and around...
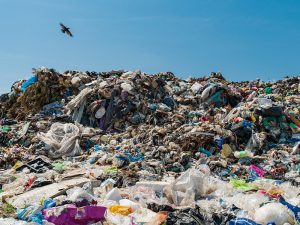
Thematic unit for the high school classroom covers all things trash at the individual, local,...

Thematic unit for the middle school classroom has students consider how their personal choices can...

Thematic unit for the high school classroom covers the connection between women’s status and population....

Thematic unit for the high school classroom covers local and global urbanization trends, challenges, and...
Video:

After matching everyday products to their rock or mineral sources, students “mine” chocolate chip cookies...
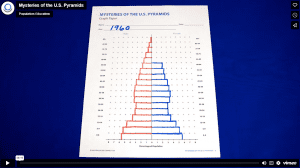
Students construct and interpret population pyramids (age-sex distribution charts) and discuss differences in population characteristics...

Students experience the changing pace of population growth by actively simulating the Earth’s population growth...

Students gain an understanding of carrying capacity when they act as predatory animals in a...
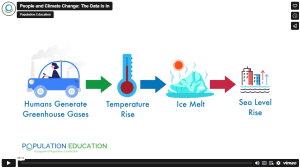
Students interpret various forms of data (graphic, written, and visual) and identify relationships between population...
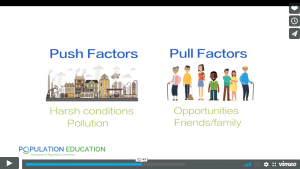
Students participate in a “push/pull” simulation to identify reasons people migrate from one place to...
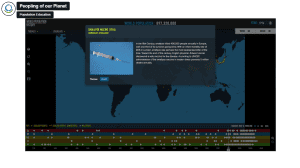
Students watch the video “World Population” and participate in guided exploration of an online timeline...
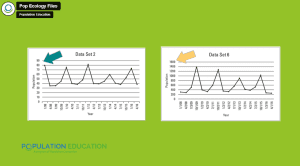
Students graph and interpret growth curves for six mystery species and humans.
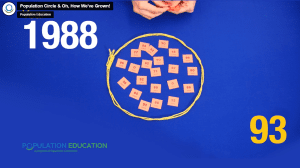
Students experience the changing pace of population growth by actively simulating the Earth’s population growth...
Tool:
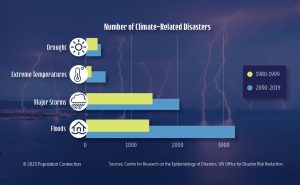
Infographic compares the number of climate-related disasters between 1980-1999 with the number of disasters between...
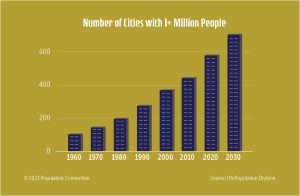
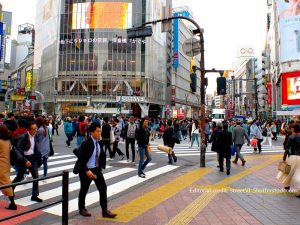
Graph shows the increasing number of cities with over 1 million residents over time. City...
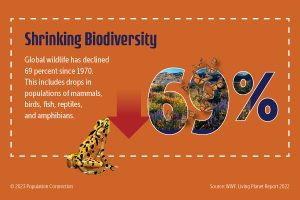
Since 1970, global wildlife has declined 69%. This includes drops in mammal, bird, fish, reptile,...
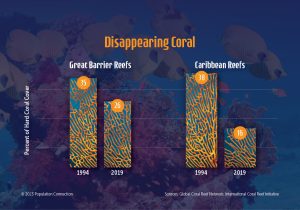
Graphs show the percentage of the Caribbean Reefs and Great Barrier Reefs over 25 years,...

Infographic compares 2000 and 2020 statistics on maternal mortality and child mortality in least developed...
Graduate Course: Making the Population Connection: Exploring the Human-Environmental Nexus in Today's Middle and High...

Pie chart shows the percentage of the population experiencing water stress. 23% of people are...

Receive Population Education's e-newsletter for new lessons and program updates. Six issues/year. Sign-up now by...
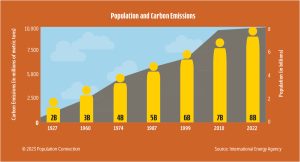
Bar graph shows change in global population from 2 billion people in 1927 to 8...