



I’m a bit of a data nerd, especially when I discover interesting data visualizations that tell a story or provide a jump-off point for more investigations around demographic trends. This fall, the Population Reference Bureau (PRB) debuted its newest World Population Data Sheet and online Data Explorer to provide critical data points on all 8.3 billion of us. In addition to their core set of demographic data (e.g. population, birth/death rates, total fertility rate) for each country, this year’s resource also includes a special set of indicators for Gender Equality and Well-Being.
Because these are excellent resources for social studies teachers and students, I was eager to dive a bit deeper into the numbers and highlight some of the interesting stories that emerged in this year’s dataset.
What makes this data especially compelling are the visualizations shown with different types of graphs (scatterplots, bar graphs, bee swarms, and choropleth maps). The interactive scatterplots can show relationships between a variety of different indicators selected by the user. These customized visualizations can start to reveal correlations but can also inspire independent student inquiry and meaningful research.
Here are some of the research paths I took starting with the PRB data.
Women’s Education and Fertility Data Story
It’s long been known that the more formal education a girl receives, the fewer children she is likely to have. That’s because more years of schooling reduce teen marriages and pregnancies, and lead to more paid employment opportunities. Women who wait longer to start a family tend to have fewer children.
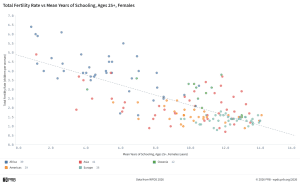
The PRB Data Explorer includes Data Stories, one of which is Women’s Education and Fertility: An Inverse Relationship. Pointing out this relationship on a scatterplot, the Data Story highlights countries at the low end of women’s educational attainment (Somalia at 0.9 years of school and a 6.4 fertility rate) and the high end (Germany at 14 years of school at a 1.3 fertility rate).
But the story also identifies two interesting outliers: Israel and Nepal.
Israel has a prosperous and highly educated population with the average woman completing nearly 13 years of school, but the fertility rate is close to 3 per woman, the highest among OECD countries. My further research on other sites provided context on Israel’s pronatalist culture, high IVF rates and financial support for working mothers.
Nepal’s data points show only 3.5 years of schooling for women and a below-replacement fertility (1.9). The Data Story explains why this snapshot leaves out important information, including the large-scale male labor migration to other countries, which has caused spousal separations and reduced fertility. Also, female schooling has increased significantly in the past 30 years and is greater for younger women, but the data point is an average for all women 25 and over.
Gender Gap in Political Power Data Story
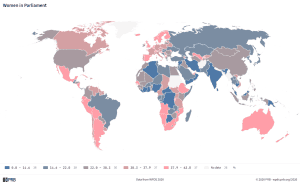
Another Data Story looks at the percentage of seats in national parliaments held by women, an indicator of women’s power and representation in their countries. The data show that even countries with high educational attainment and labor participation for women may not prioritize parity in politics. In fact, I learned that only 7 out of 180 countries have 50 percent or more women in parliamentary bodies. The U.S. is #84 with 28.9%. And the top countries may not be the ones you’d suspect — Rwanda (63.8%), Cuba (57.2%), Nicaragua (55.5%), Bolivia (50.8%) and Mexico (50.4%). The national constitutions in most of these countries set quotas for either the percentage of seats or candidate slates to include women.
In 127 countries, women hold fewer than one-third of seats, even though they constitute half of the population. Cultural and structural barriers have long disadvantaged women in leadership roles. While more seats are held by women than any time in the past, UN Women estimates that global parliamentary parity will not be reached until around 2063 at current rates of progress.
Maternal Health & Wealth Scatterplot
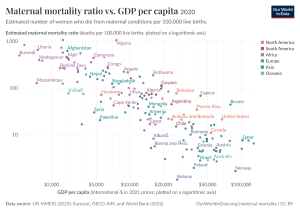 Maternal mortality ratios (MMR) have dropped globally over the past 30 years, but there’s still a huge disparity among countries and world regions. Looking at the MMR data on a scatterplot, along with country income data (GNI per capita), I can see a strong correlation between wealth and maternal survival. For high-income countries, that ratio is 10 deaths per 100,000 births while in the low-income countries, the rate is 320 deaths per 100,000 births.
But looking at individual countries reveals that income alone is not the only determinant. For example, the United States has one of the highest per capita incomes in the world, yet its MMR is higher than most other high-income countries and even some middle-income countries. Disparities in healthcare coverage and accessibility in the U.S. have created a system of fragmented care and large gaps in health outcomes among different areas of the country. Some of the lowest MMRs are in middle-income countries (e.g. Belarus, Albania and Tajikistan) with strict healthcare mandates and universal medical coverage.
These same health and income dynamics show up in another PRB Data Story, The Income-Longevity Connection which focuses on women’s life expectancy around the world. Higher income levels are strongly associated with longer lives but the story also highlights countries which have achieved higher life expectancies with fewer resources.
More Gender Data to Explore
Other indicators in the Gender Equality and Well-Being section of 2026 World Population Data Sheet and the Data Explorer include labor participation for women and men, prevalence of contraceptive use, and youth living with HIV. In addition to the Data Stories that provide insights on different indicators, PRB includes helpful guides to explain the different types of graphs and charts and how to use them to represent various ways of seeing the data. This is especially helpful in building students’ data literacy skills.
All PRB’s data points are a snapshot in time for 2026. Other excellent data sites, including Our World in Data and World Bank’ Atlas of Global Development show change in these data points over time. The World Bank site uses data stories with dynamic visualizations to highlight trends on human development and environmental challenges.
Image credits: Women’s education and Fertility data (Mean Schooling for Females vs Total Fertility Rate 2026 by Population Reference Bureau); Women in Parliament (Women in Parliament 2026 by Population Reference Bureau); Maternal health and wealth (Maternal mortality ratio vs. GDP per capita 2020 by Our World in Data is licensed under CC BY 4.0)