Filter
Resources
Classroom Resources
Lesson Plan:

Students test different pH solutions on radish seeds to determine the optimal level for seed...

Students discuss the concept of biotic potential and use equations to determine how a family...
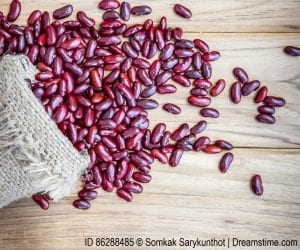
Students use beans to model population growth in several mystery countries while varying four key...

Students investigate three different data sets covering maternal mortality, and articulate the benefits and shortcomings...

Small groups construct 3-D communities using various amounts of funds and then compare the communities...

Students mimic the spread of disease by exchanging liquids in test tubes in a hands-on...

Students experience the changing pace of population growth by simulating the Earth’s population growth over...

Students solve word problems and use packing peanuts to visualize how much CO2 is produced...

Students participate in a simulation and gardening lab for hands-on experience with the effects of...
Reading:

An elementary-level reading that discusses population growth trends for wildlife and people.
Lesson Packet:
U.S. population takes center stage in this downloadable packet of classroom lessons, 330 Million in...

Thematic unit for the middle school classroom covers issues related to garbage and solid waste...

Thematic unit for the high school classroom on outdoor and indoor air pollution. Includes teaching...

Thematic unit for the high school classroom on biodiversity issues, endangered animals, and extinction rates....

Thematic unit for the high school classroom covers a wide range topics related to climate...

Packet of 2025 Earth Day lesson plans for K - 5th grades is free to...

Thematic unit for the high school classroom on energy issues in more developed and less...

Thematic unit for the high school classroom on food issues and agriculture. Includes teaching materials...

Thematic unit for the high school classroom covers global health from a societal perspective. Includes...
Video:

In this climate change lesson, students solve real-world word problems and use packing peanuts to...

Engage lower elementary students with a hands-on gardening and plant growth simulation lab designed to...

In this interdisciplinary activity, students take on the role of store owners and conduct a...
In two interactive simulation games, students develop and apply short-term consumption strategies to maximize shared...

In this fun interactive activity, students role-play as plants or animals collecting vital habitat elements...

Students estimate population size by using math manipulatives on a grid models in this hands-on...

In this interactive math enrichment lesson, students develop a deeper understanding of large numbers by...

This engaging, hands-on STEM and earth science lesson introduces students to the connection between natural...
Tool:
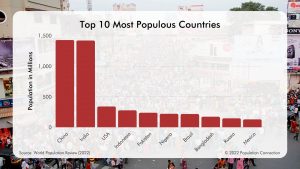
Bar graph shows the populations of the 10 most populous countries. The top 10 most...
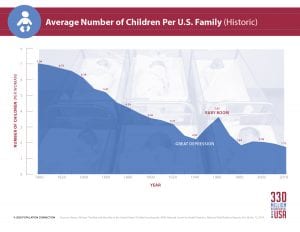
Line graph shows the average number of children per woman in the United States over...
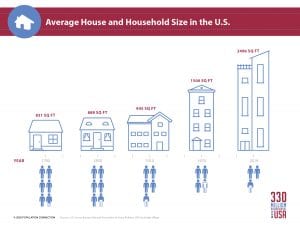
Infographic shows that the average size of houses in the United States has increased from...
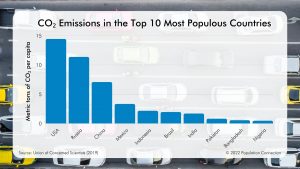
Bar graph shows the amount of carbon dioxide per capita, in metric tons, is emitted...
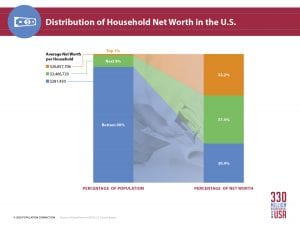
Infographic shows the how household net worth in the U.S. is distributed among the population....

Infographics shows that 1 person in the U.S. consumes as much energy as 2 French,...

Infographics show the change in global meat production from 1974 to 2022 and the corresponding...

Bar graph shows change in global population from 2 billion people in 1927 to 8...

Population pyramids (age-sex diagrams) for Tanzania, Peru, and Norway have different pyramid shapes showing different...


