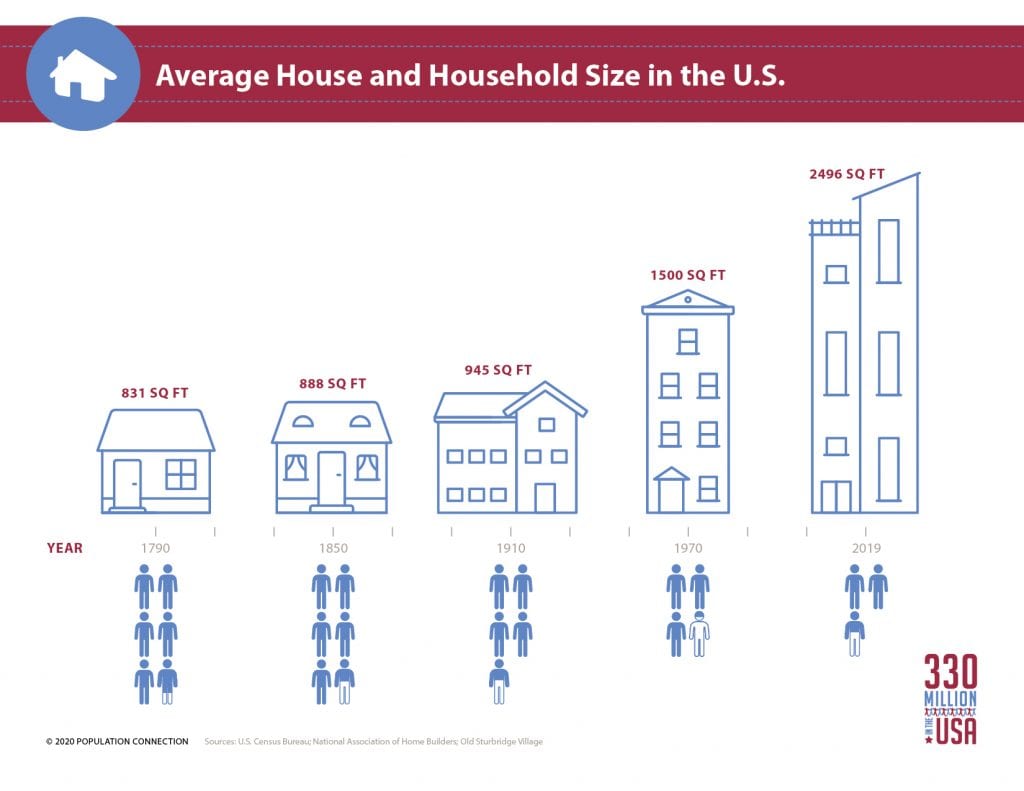
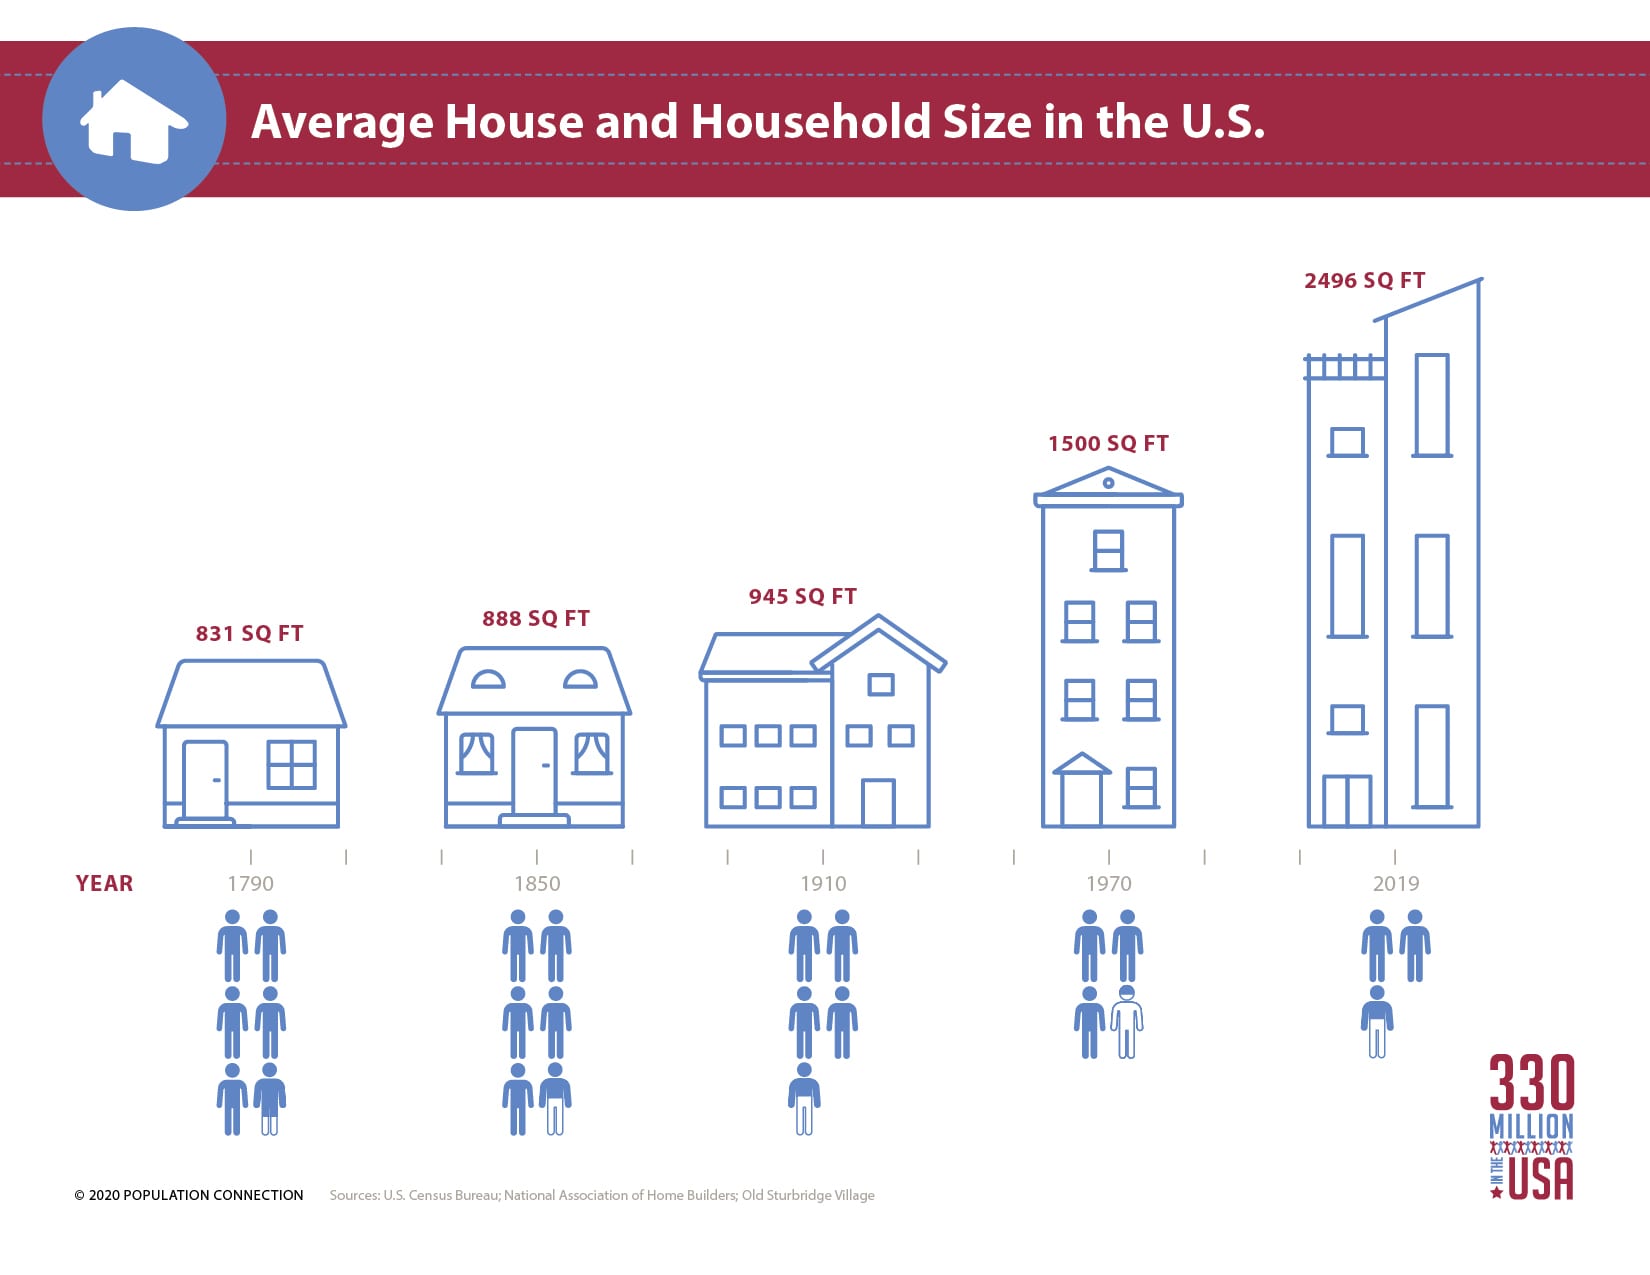
Infographic shows that the average size of houses in the United States has increased from 831 square feet in 1790, to 945 square feet in 1910, to 2,496 square feet in 2019. Over the same time range, the number of people living within each house as decreased. The average number of people per house in 1790 was nearly six, but by 2019 the average number of people per house had dropped to less than 2.5.
Data sources: U.S. Census Bureau; National Association of Home Builders.
Graphic produced as part of the 330 Million in the USA lesson packet.
Other Resources You Might Like:

Students create a population density map of U.S. population over time, from 1800 to today.

Earth graphics display human's growing global footprint from 1970 to 1995 to 2022.

Students investigate U.S. wealth distribution and analyze historic documents related to the American Dream.
Nice to meet you!
Tell us a bit about yourself so we can continue creating resources that meet your needs.
You’ll only need to fill out this form once. If you’ve already completed the form, you can confirm your email here.