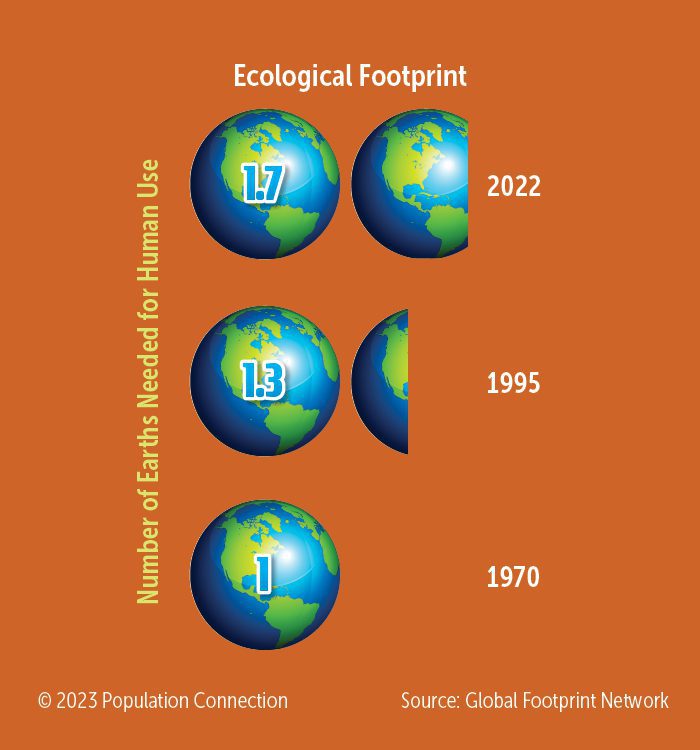
Infographic compares the number of Earths needed to provide for humans’ current consumption over time. Earth graphics are used to compare the total human population’s ecological footprint in 1970, 1995, and 2022.
Data is from the Global Footprint Network.
Graphic originally published on the Quick Trip to 8 Billion wall chart.
Other Resources You Might Like:

Packet of 2025 Earth Day lesson plans for 6th, 7th and 8th grades is free to download! Perfect resource for... Read more »

Students compare the life cycle stages of four everyday products in order to hypothesize which item has the lowest environmental... Read more »
Nice to meet you!
Tell us a bit about yourself so we can continue creating resources that meet your needs.
You’ll only need to fill out this form once. If you’ve already completed the form, you can confirm your email here.