Population Pyramids
- Lesson Plans
- Articles
- Infographics
- Readings
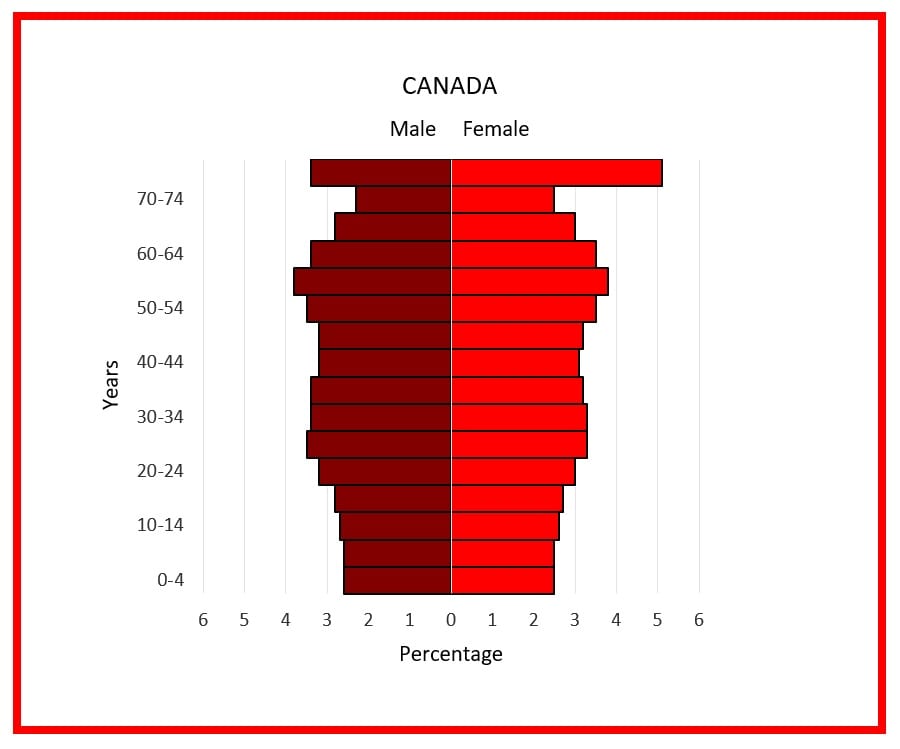
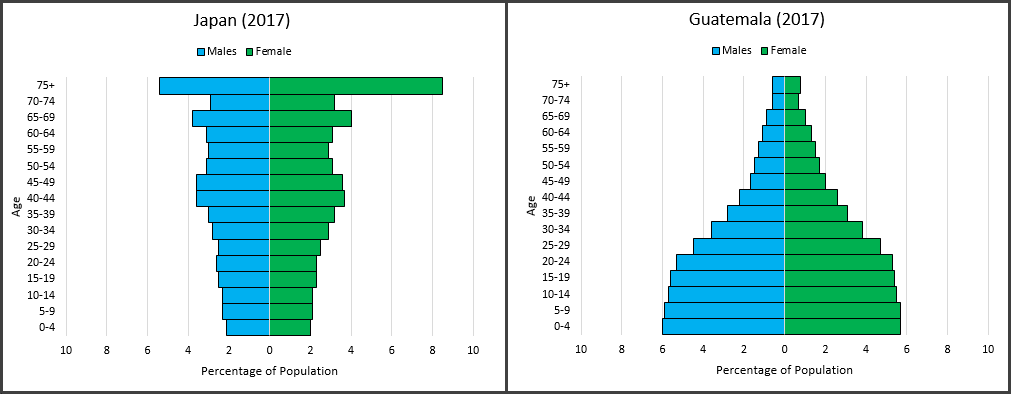
Many of the vast differences we see in societies across the globe can be related to the composition of their respective populations. So when exploring variations among countries, a good place to start is with their population pyramids – graphs that display the age and sex distribution of the country’s population. These age structure diagrams depict the configuration of a country’s population as impacted by 80+ years of economic, political, and natural events.
Teachers' Favorites
Check out our most popular offerings for teaching about population pyramids

Power of the Pyramids
Students use real-world data to construct and interpret population pyramids and discuss differences in population growth rates among several different…
Go To Resource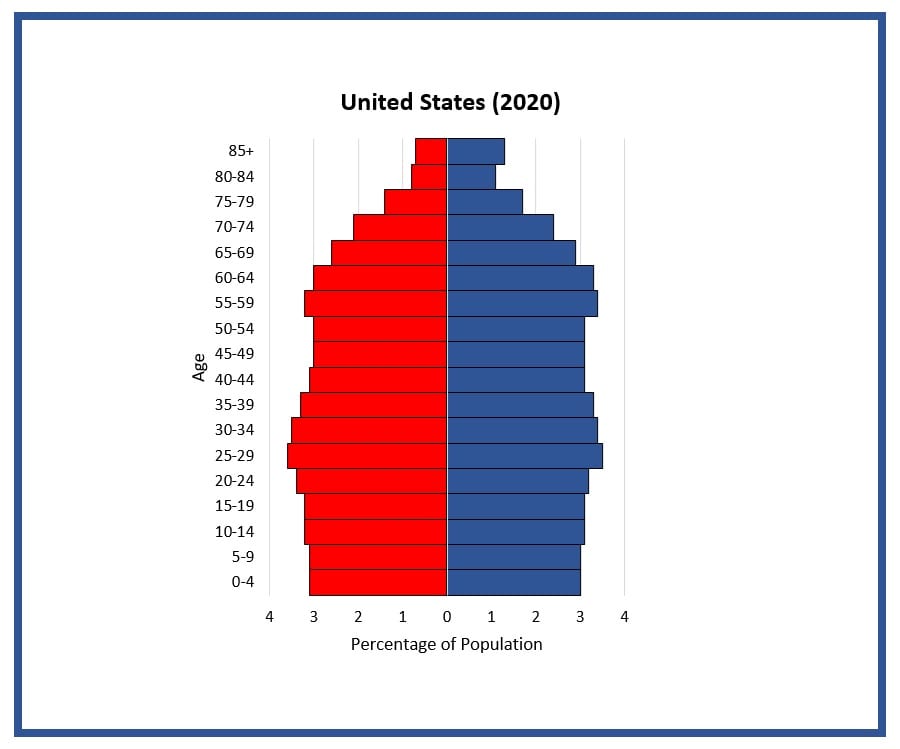
Students construct and interpret population pyramids (age-sex distribution charts) and discuss differences in population characteristics at different points in U.S.... Read more »

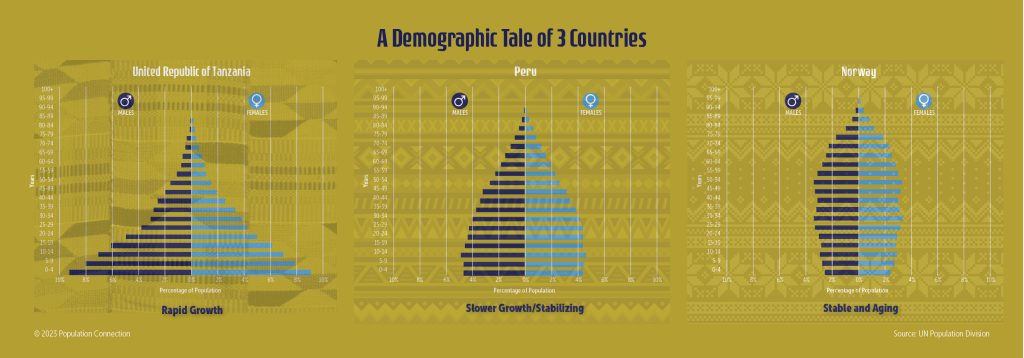
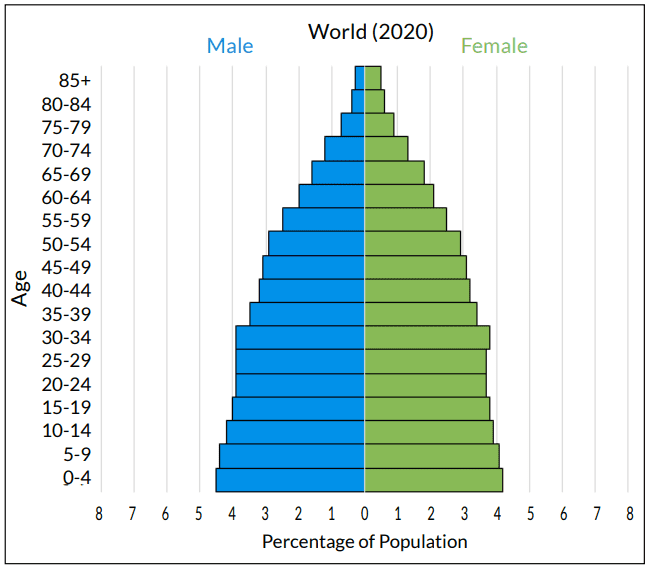
Three age structure pyramids compare different population pyramid shapes and growth rates.
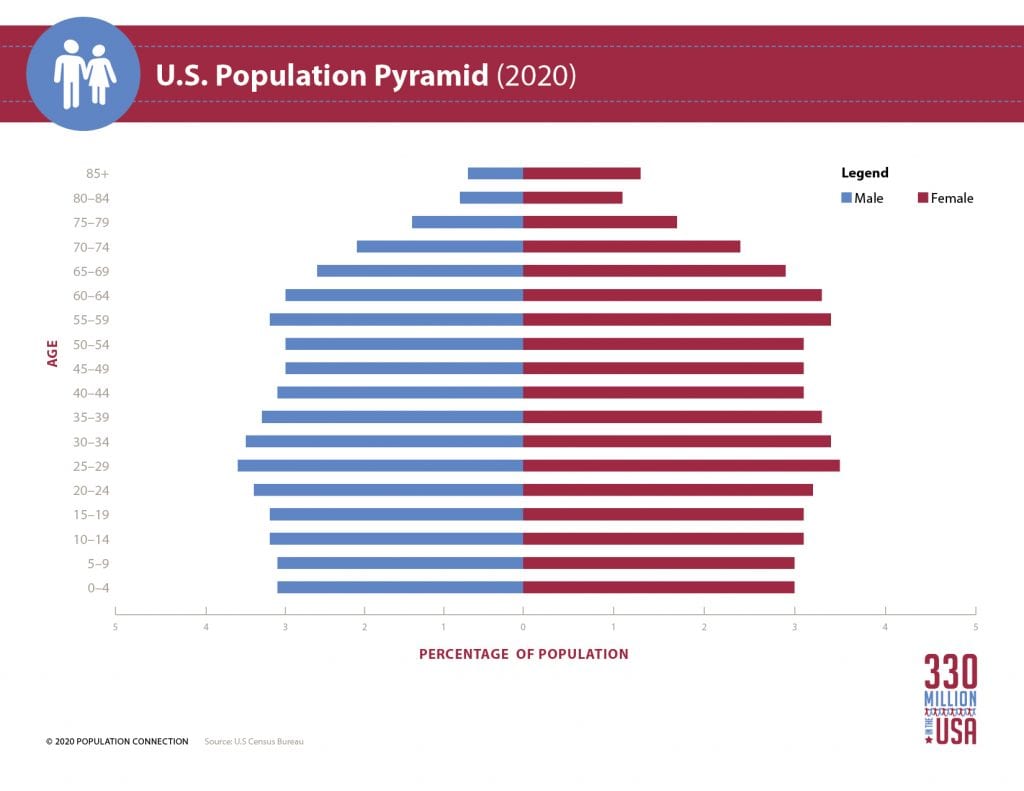
Unites States' population pyramid, or age structure diagram, for the 2020 population.
More Fun Ways to Teach Population Pyramids
Go further with population pyramids using these 5-star rated classroom materials
Making a population pyramid, or age-sex distribution graph, in Excel has never been easier than with this step-by-step guide that... Read more »

You might know the three basic shapes of age structures (popularly referred to as population pyramids) and what they mean.... Read more »
Students use real-world data to construct and interpret population pyramids and discuss differences in population growth rates among several different... Read more »
Additional Information on Population Pyramids
Interested in a deep dive? Learn something new with the articles, websites and lessons below
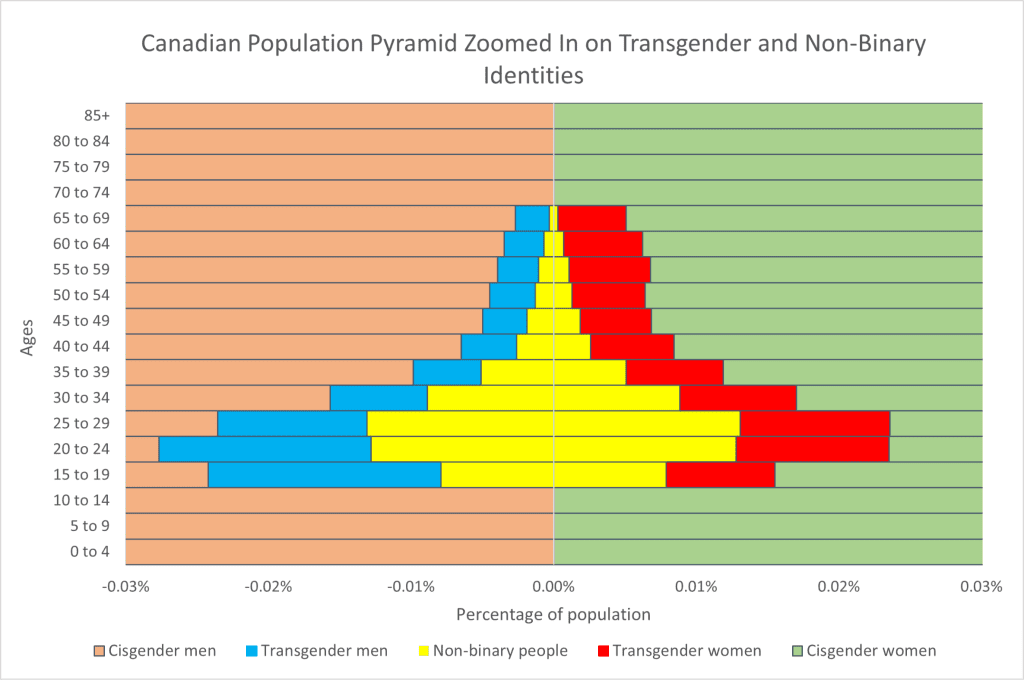
The sex identification on a population pyramid, or age structure diagram, typically reflects biological sex as assigned at birth, and... Read more »
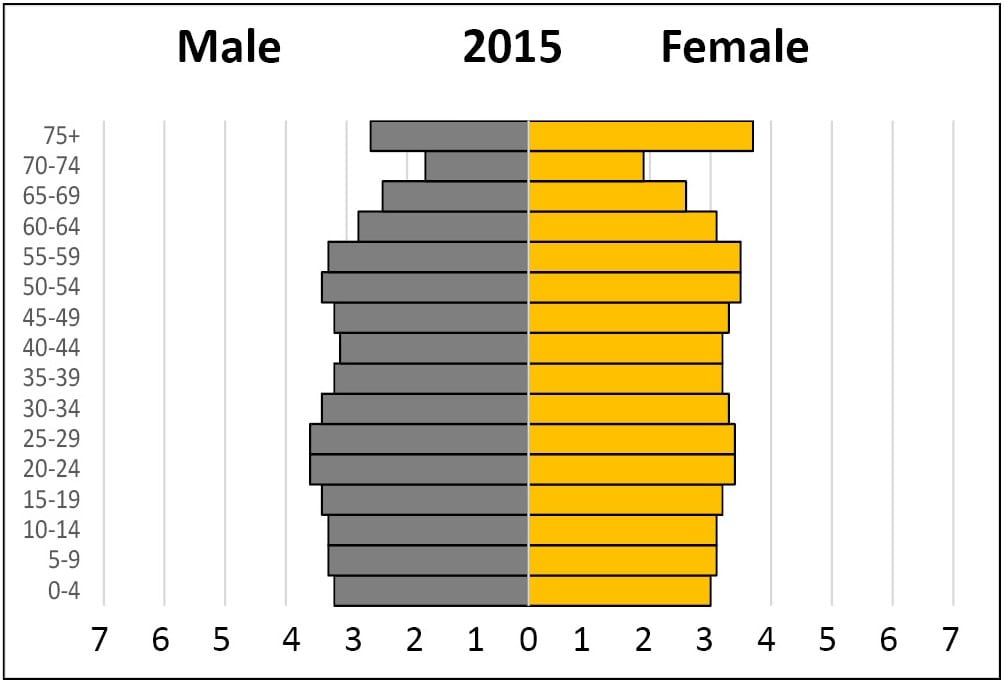
The baby boom generation is interesting to view on a population pyramid because it’s where the graph is at its... Read more »
Population pyramids are used by demographers as a tool for understanding the make-up of a given population, whether a city,... Read more »
A population pyramid, or age structure graph, is a simple graph that conveys the complex social narrative of a population... Read more »
Why do highly developed countries tend to have higher death rates than many less developed countries? This question often comes... Read more »

Students watch the video “World Population” and participate in guided exploration of an online timeline to explore how improvements in... Read more »