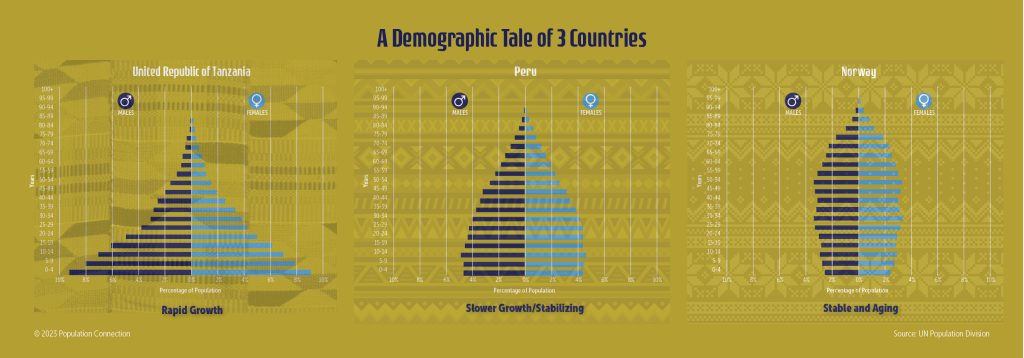
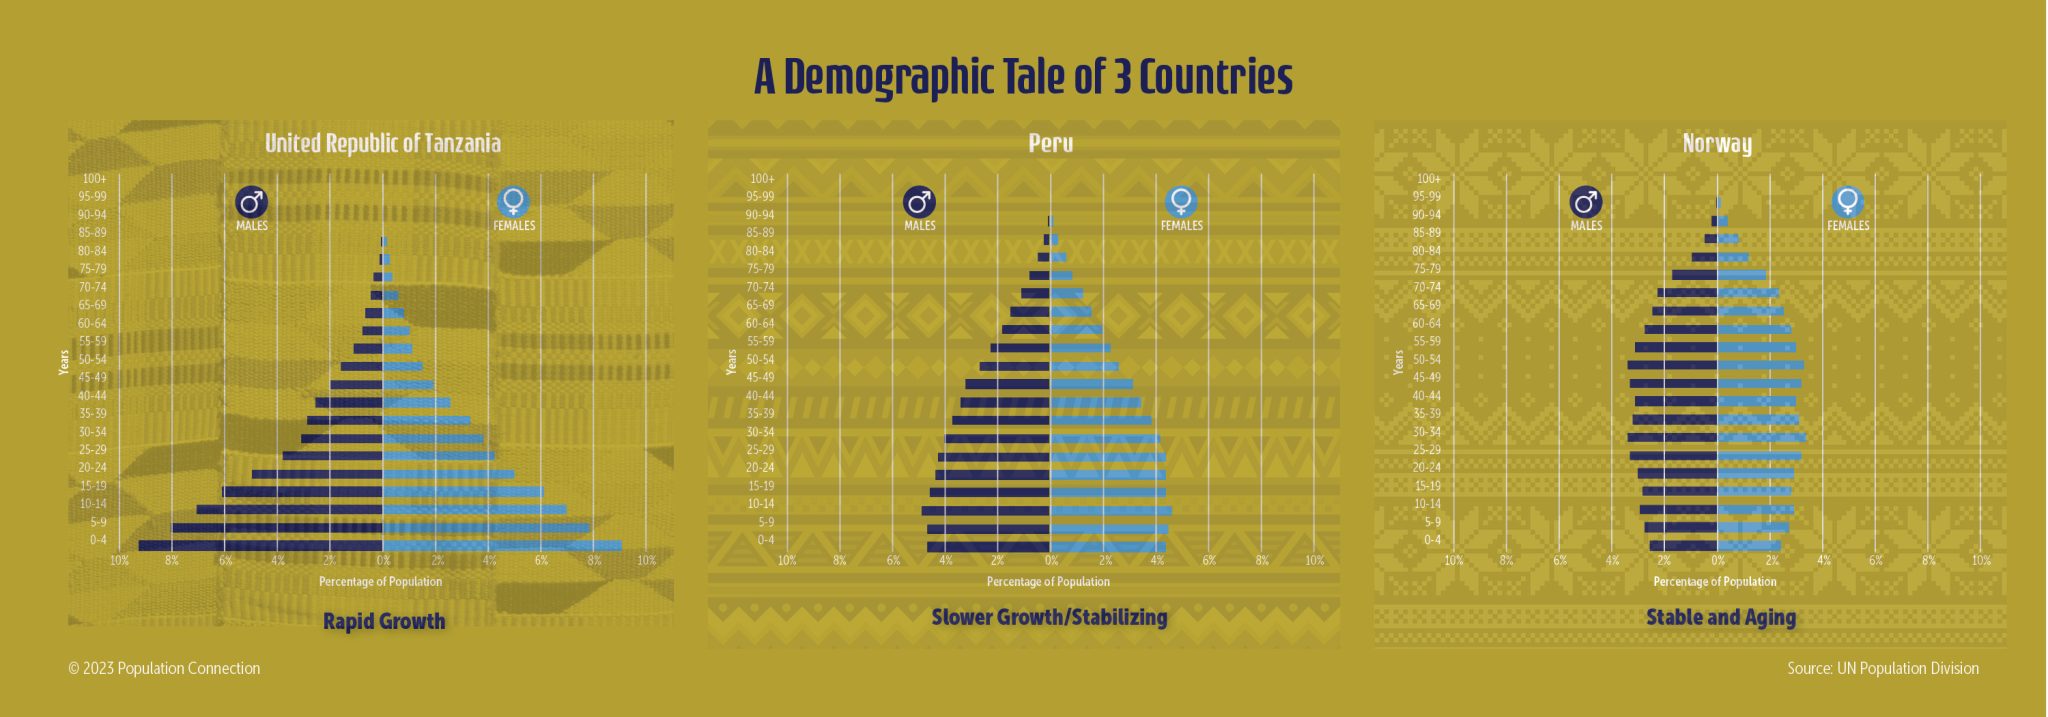
Population pyramids (age-sex diagrams) for Tanzania, Peru, and Norway have different pyramid shapes showing different population growth rates. These pyramids can also be used in conjunction to teaching about the demographic transition model.
Data sources: UN Population Division
Graphic originally published on the Quick Trip to 8 Billion wall chart.
Other Resources You Might Like:
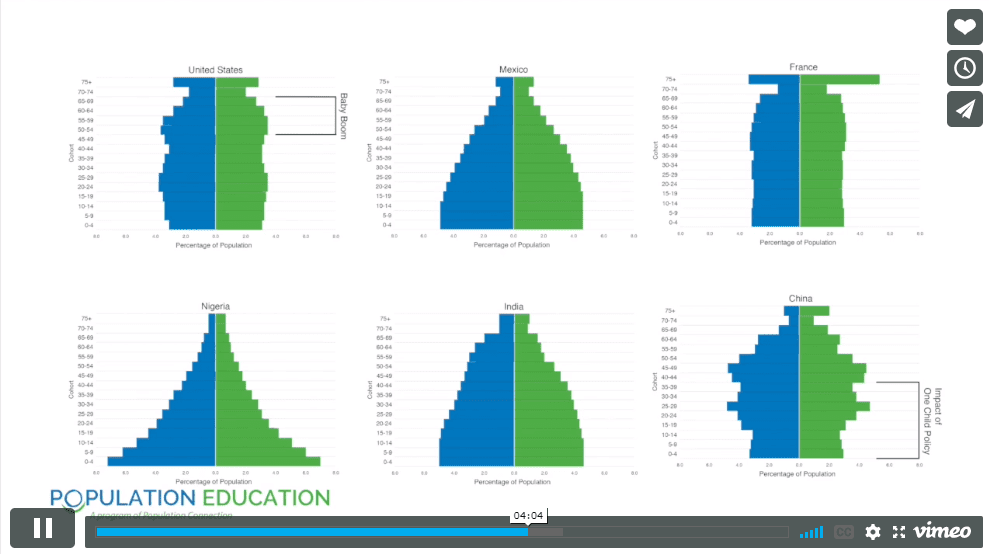
Students construct and interpret population pyramids for six different countries in this lesson. By analyzing age and sex distribution, they... Read more »

Students use real-world data to construct and interpret population pyramids and discuss differences in population growth rates among several different... Read more »
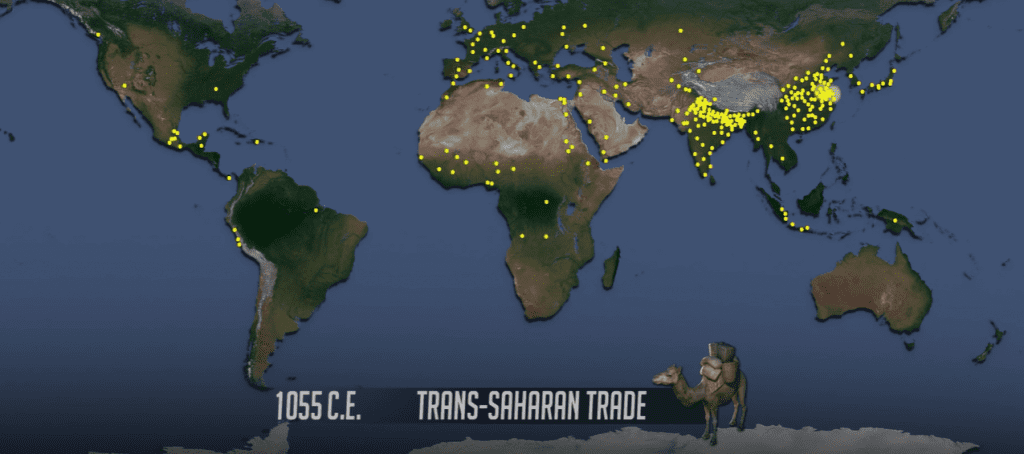
This powerful population growth video provides a fast-paced visual overview of human population trends from 1 CE to the present,... Read more »
Nice to meet you!
Tell us a bit about yourself so we can continue creating resources that meet your needs.
You’ll only need to fill out this form once. If you’ve already completed the form, you can confirm your email here.