Grade Level:
9-12
Teacher Resources
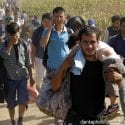
Population Dynamics case study reading: Explore migration to the European Union: the push factors forcing people from...

Population Dynamics case study reading: Examine two countries with sub-replacement fertility rates, their path to this status,...
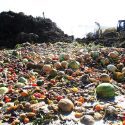
Food and Agriculture case study reading: An in-depth look at the food supply chain in the United...


Students express their thoughts on issues related to population and the environment, then research a specific issue...
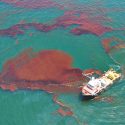
Students use the engineering design process to create and test prototypes for cleaning up oil spills. Students...

In two simulation games, students determine individual short-term consumption strategies that will maximize resources for the entire...

An apple is sliced into pieces to model the current amount of agricultural land on Earth. Then...

Students investigate three different data sets covering maternal mortality, and articulate the benefits and shortcomings of each...
PopEd Impact
campuses
"The activities not only bring out important content, but they also provide real-world context for environmental, population and sustainability issues. They engage participants in very thought-provoking and critical-thinking discussions.”
Helen de la Maza, Environmental Educator, Irvine, CA