Grade Level:
9-12
Teacher Resources


Personal consumption case study reading: Examine how fast fashion (like H&M, Zara, Shein, etc.) impacts the environment...

Air pollution case study reading: Examine the impact of sulfuric smog in London from the Industrial Age...

Students investigate a provided set of graphs on current economic, environmental, and health trends in the USA.
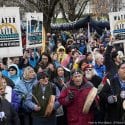
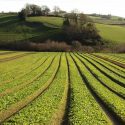
Explore the human - environment relationship from early U.S. settlements to climate activism.
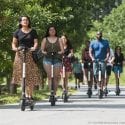
Trace the history of U.S. transportation from horsedrawn carriages to our present car culture.
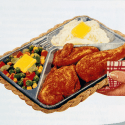
Survey of U.S. food trends - where it's from, how it’s prepared, and who has access.

Journey through the history of schooling in the U.S. from the early 1800s to today.
PopEd Impact
campuses
"The activities not only bring out important content, but they also provide real-world context for environmental, population and sustainability issues. They engage participants in very thought-provoking and critical-thinking discussions.”
Helen de la Maza, Environmental Educator, Irvine, CA