Grade Level:
9-12
Teacher Resources
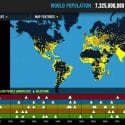
Interactive map of world population growth with annotated population "dots," data overlays, and thematic timelines.

Set of 4 lessons and 2 readings on the human dimensions of climate change.
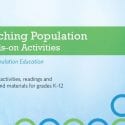
"Best of" library of readings and lesson plans with interactive methods for all subject areas.
Set of 14 lesson plans and 6 readings on U.S. population history and trends.
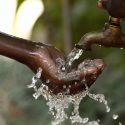
Set of 2 lessons and 3 readings cover global water topics as well as individual use.

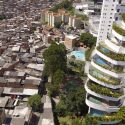
Set of 4 lessons and 2 readings cover local and global urbanization trends, challenges, and opportunities.

Set of 2 lessons and 2 readings cover the connection between women’s status and population.
Set of 4 lessons and 2 readings cover a wide range of topics related to poverty and...
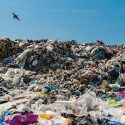
Set of 3 lessons and 2 readings cover all things trash at the individual, local, and regional...
PopEd Impact
campuses
"The activities not only bring out important content, but they also provide real-world context for environmental, population and sustainability issues. They engage participants in very thought-provoking and critical-thinking discussions.”
Helen de la Maza, Environmental Educator, Irvine, CA