Resource Overview
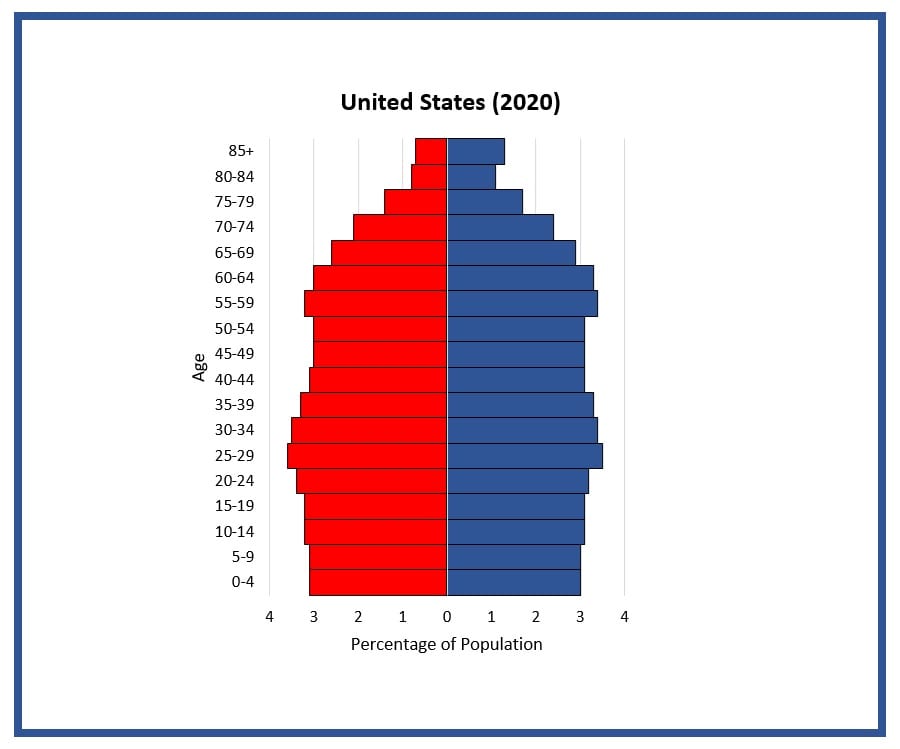
Students construct and interpret population pyramids (age-sex distribution charts) and discuss differences in population characteristics at different points in U.S. history and make projections for the future.
Students will be able to:
- Calculate percentages using raw numbers for each age/sex group in a given population.
- Construct a population age/sex distribution graph for one point in U.S. history.
- Make connections between the shape of a population pyramid graph and factors that may have affected U.S. population patterns at different time periods.
Features of This Resource
- Great lesson for U.S. History classes
- Explores changes in demographics of the United States over time
- Includes age structure diagrams for the United States at various times in history

How Do I Get This Lesson Plan?
The resource is free. Click the green button for immediate download. Download Now
Other Resources You Might Like:

USA Population Circle
Fun large-group simulation of U.S. population growth since the first census in 1790.
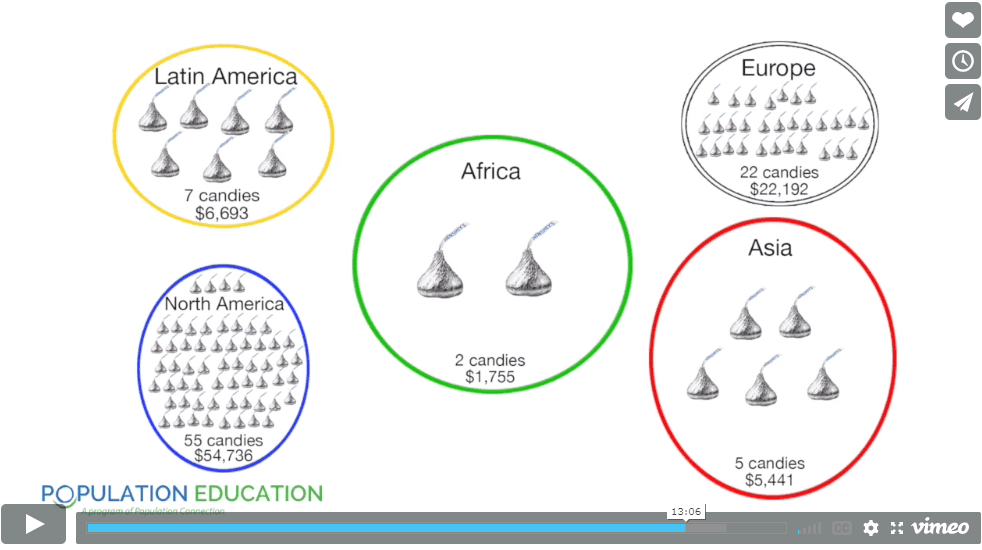
Food for Thought
In this engaging global studies activity, students role-play as residents of five major world regions to compare key statistics related... Read more »
Grades 9-12
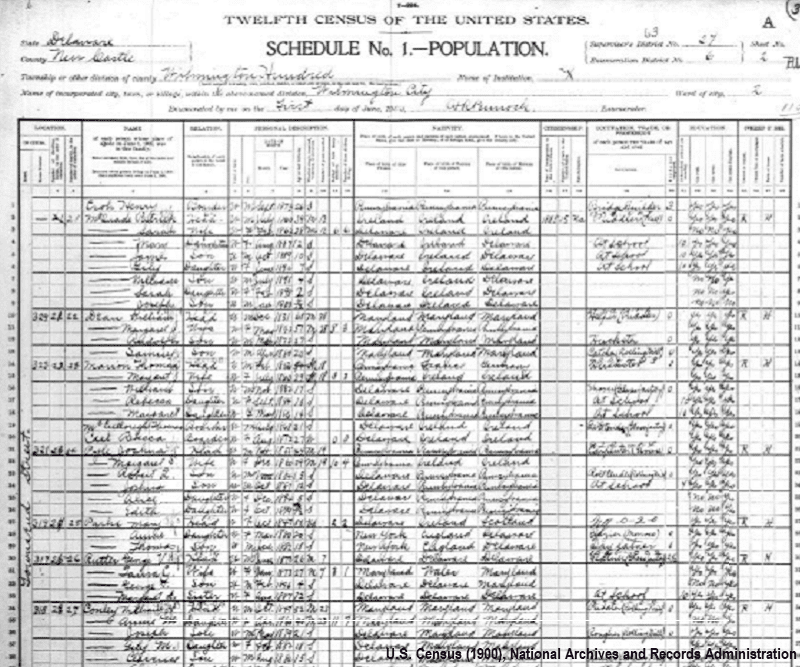
Family Counts
Students examine historic census data to investigate U.S. family size over time.
Nice to meet you!
Tell us a bit about yourself so we can continue creating resources that meet your needs.
You’ll only need to fill out this form once. If you’ve already completed the form, you can confirm your email here.