The best opportunity to teach your students about the United States census only happens once every ten years. At Population Education we want to make sure you can still seize this teachable moment even while practicing distance learning.
Last week PopEd hosted a free teacher webinar to demonstrate distance learning lessons to teach about the census. We had over one hundred social studies and math educators tune in from all over North America. The webinar was such a success that we want to share these free online teaching materials with an even larger audience of educators!
Blended Learning Lessons to Teach About the Census
This blog includes six different blended learning lesson plans that you can use to teach the census in your online classrooms. The lesson plans described below include links to a Google Drive with spreadsheet and worksheet templates for students’ online collaboration. All lessons include detailed instructions in easy-to-read PDF files for your convenience.
We start with lessons that look at the census itself, collecting and organizing a population’s data. We then move to lessons that analyze census data and expand on how data is used in practical ways like city planning and congressional apportionment.
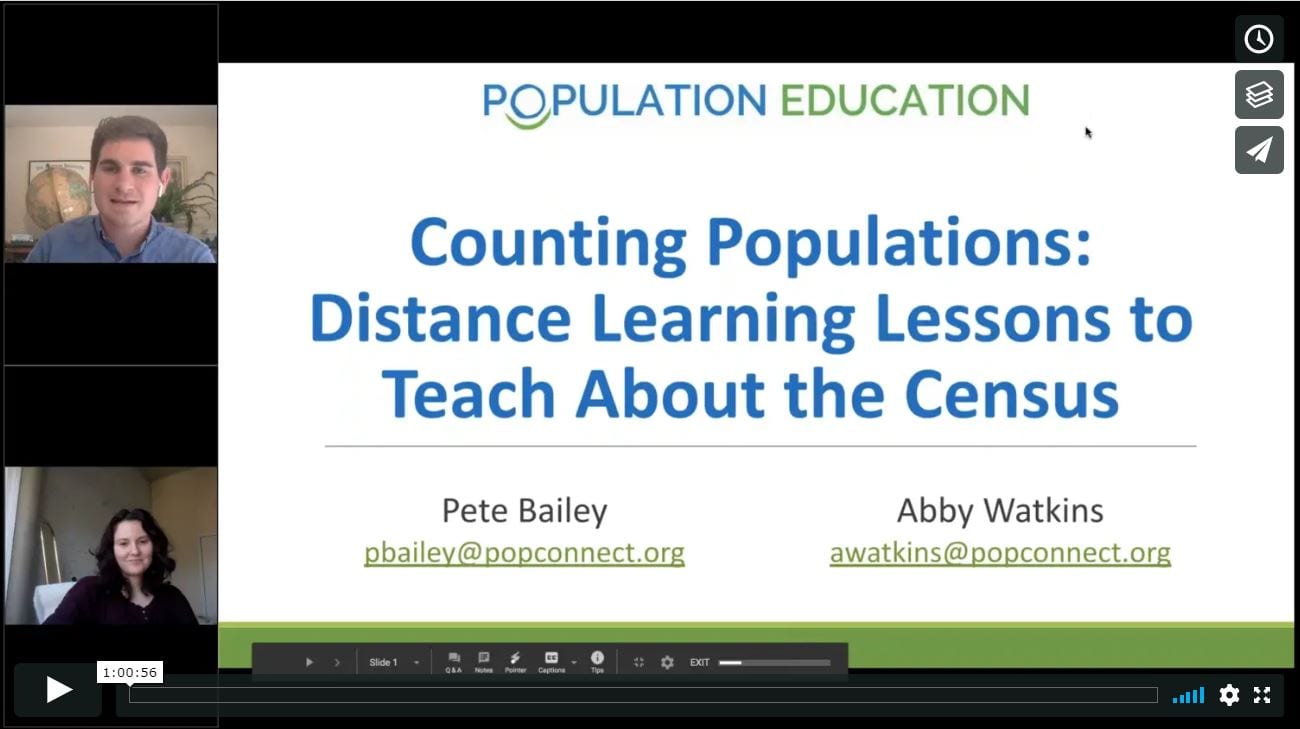
Stream the recording of the full census distance learning webinar now to watch our staff explain not only each lesson plans’ content, but also e-learning strategies and methods for online implementation.
The census only comes around one every ten years, so don’t wait until 2030 for this teachable moment!
High Schoolers Explore Historical Census Data
Family Counts is a high school lesson plan that starts with students interrogating real, historic census data from a Delaware county at four points in history to examine how fertility rates may have changed over time.
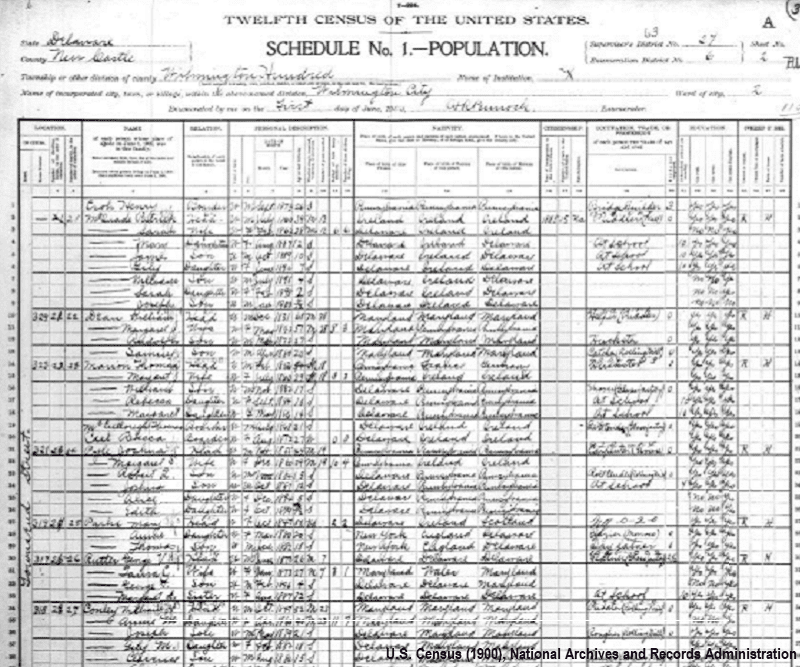
You’ll provide students one of four Census Sheets with data from 1800, 1850, 1900, or 1940. Students use this data to answer a number of questions (on the provided worksheet) that both check for data understanding and have students draw their own conclusions about broader demographic trends. These worksheets can either be assigned for students to complete in virtual groups or to be completed individually.
In the second part of this activity, students tally the sizes of multiple generations of their families plus one generation of their future family. The class as a whole combines this data to make a larger data set which can then be compared against broader trends in the United States. Finally, students use the data analysis skills they have practiced in the first two parts of this activity to compare fertility rates against other demographic indicators throughout U.S. history.
Middle School Students Conduct a Census
Everything Counts is a middle school lesson plan where students role play as members of a city council that has received a plot of donated land to benefit the community. In order to understand the demographics of the city and the needs of the city, the council decides to take a census of its residents. In class, your students will conduct a census a census and use their findings in the simulation.
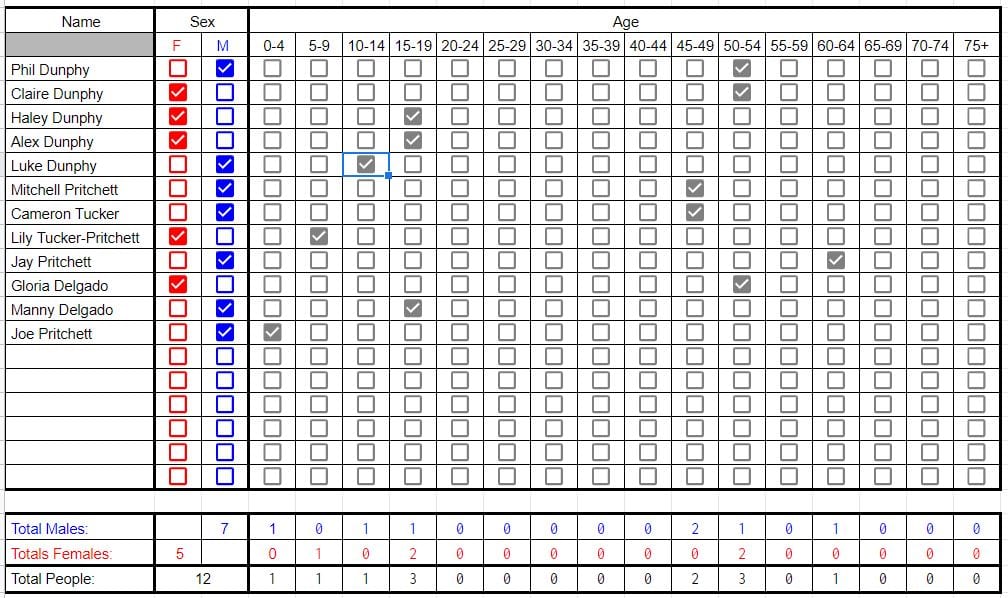 In groups, students first gather information about their classmates’ households – everyone who lives in their residence. The lesson, mimicking a real-world census, requires the first name, age, and sex of each person. To record this information, teachers should make a copy of the Google Sheet Everything Counts Survey and Graph and provide it to the students. This is where students will record the information they gather. To collect data students can use video conferencing tools, call or text classmates over the phone, or use fictional households.
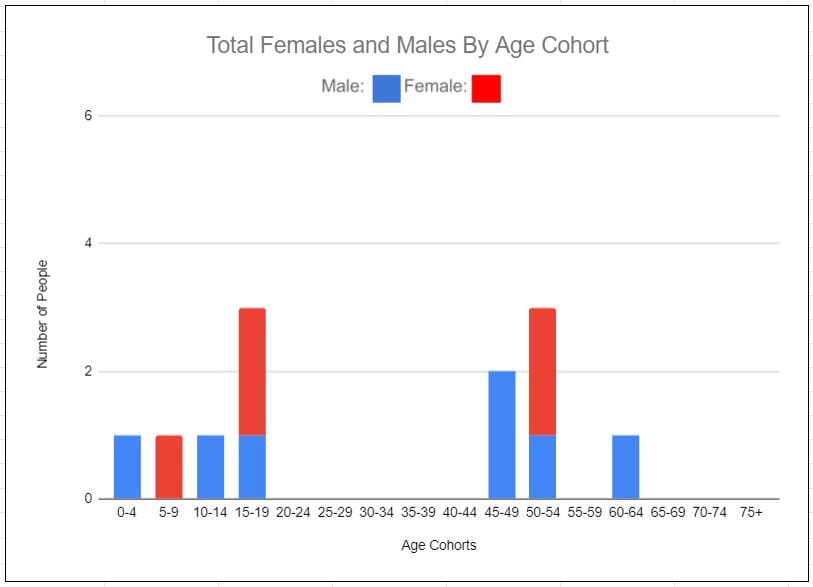 This spreadsheet will automatically populate the students’ information into a bar graph. However, teachers also have the option to remove the formula so that students create their own graphs.
Once students have collected, organized, and graphed their data, they will analyze the results of their census. Each group will propose a plan for the undeveloped land based on their census and present their plan, and reasoning, to the class over a live video feed. Students should be ready to answer questions about their decision, and also ask questions about the decisions of other groups.
The second part of Everything Counts is especially useful for middle school math teachers. Students are told that their development has been approved, but a threatened population of mice has been found on the donated plot of land. Before continuing with their project, students must find a way to estimate the number of mice, and are introduced to three estimation strategies: gross estimate, direct estimate, and capture and recapture. Students will decide the best method to count the endangered mouse population by testing out the different estimation strategies. These strategies can be performed at home using household items and a provided grid.
2 Methods for Constructing Electronic Population Pyramids
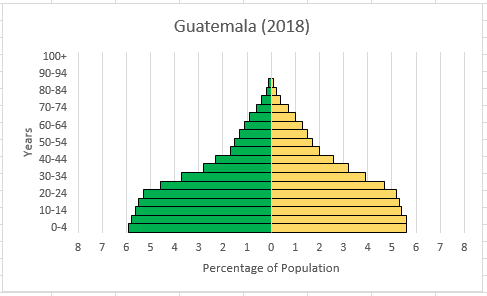
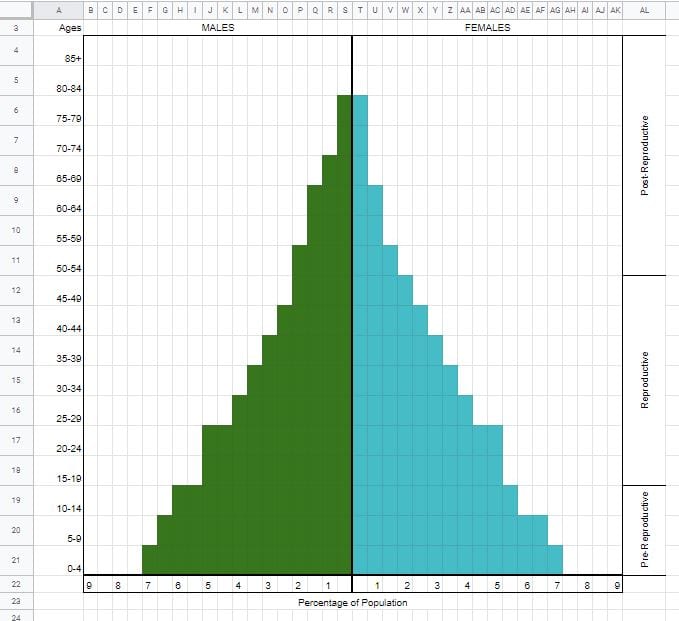
Census data is often used by demographers to construct population “pyramids,” or graphs that show the overall age and sex distribution of a certain population, often of a particular country. Having students construct population pyramids is a great way to let them interpret and play with data.
Our step-by-step guide walks students through each part of the process of graphing their own population pyramids in Excel, from locating their data sets to using Excel tools to create labeled bar graphs. This is a great option if you want students to practice using spreadsheets, work with formulas, and have detailed population pyramids.
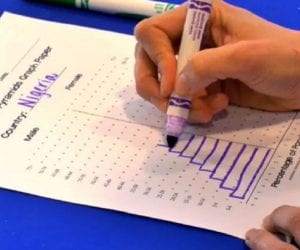
 We have also provided a Google Sheets template that allows students to draw a population pyramid by manually coloring in cells to create the pyramid, much as they might color in cells on a physical worksheet. This method is much faster and doesn’t require the ability to follow detailed instructions, but the resulting pyramids will not be as exact.
For teachers looking for a lesson plan incorporating population pyramids, we have included Mysteries of the U.S. Pyramids, where students compare the age-sex data for the population of the United States at different points in history.
Middle Schoolers Imagine Cities that Meet Everyone’s Oxygen Needs
In the activity Green Spaces, middle school students consider how much green space is necessary to produce oxygen for each person in a community, then design a community that meets both its residents’ oxygen needs and their general needs.
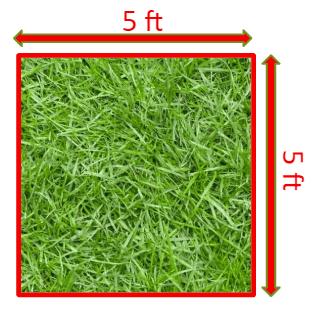 After learning that each person needs 25 square feet of grass to meet their daily oxygen needs, students work offline to create a visualization of what this space might look like. Students use string and four heavy objects (like a textbook or can of beans) to delineate a space either in their house or outside that measures 5 feet by 5 feet.
Once students have completed this first part of the activity, they move on to designing their own green city. We’ve provided a Google Sheets document that includes all of the instructions for the activity as well as the grid that students need to design their own city.
They’ll first take a look at a current city that has already allocated its space for housing, transportation, and other types of land that people use every day. They’ll do some calculations to determine whether or not there’s enough green space for everyone living in that city (hint: there’s not!). Students are then challenged to come up with some realistic ways that they could reallocate space to make room for this crucial greenery. They might add rooftop gardens to residences or include more mixed use commercial-residential spaces.
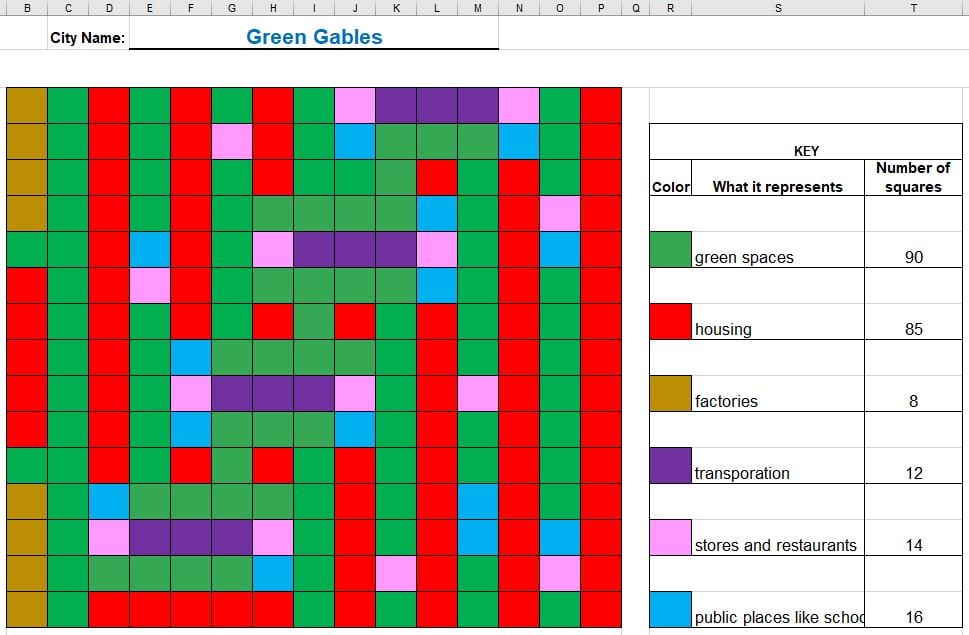 Finally, students take the lessons they’ve learned from the current city to design their own city using the Planning Grid included in the Google Sheets document. Students will create their own key for the different types of land and fill in the grid to match the space allocation that they’ve determined is appropriate for their city. We have included grids with 225 squares and 900 squares, depending on what is most appropriate for the grade level of your students.
Smart Growth and Urban Planning Activity for High School Students
Growing Smarter, another city planning activity, is geared toward high school social studies and environmental studies classrooms.
Using a separate Google Docs, groups of students first identify and list characteristics of urban sprawl such as highways, shopping centers, low density housing, decreased wildlife, etc. Next, students use a provided graphic organizer to categorize the urban sprawl characteristics as: social, political, economic, and environmental, as well as explain how each characteristic affects the area. Finally, groups determine how smart growth urban planning could have prevented some of these urban sprawl effects from taking place. For example, revitalizing a downtown area could lead to more residents choosing to live in an urban center and support local businesses rather than large shopping centers.
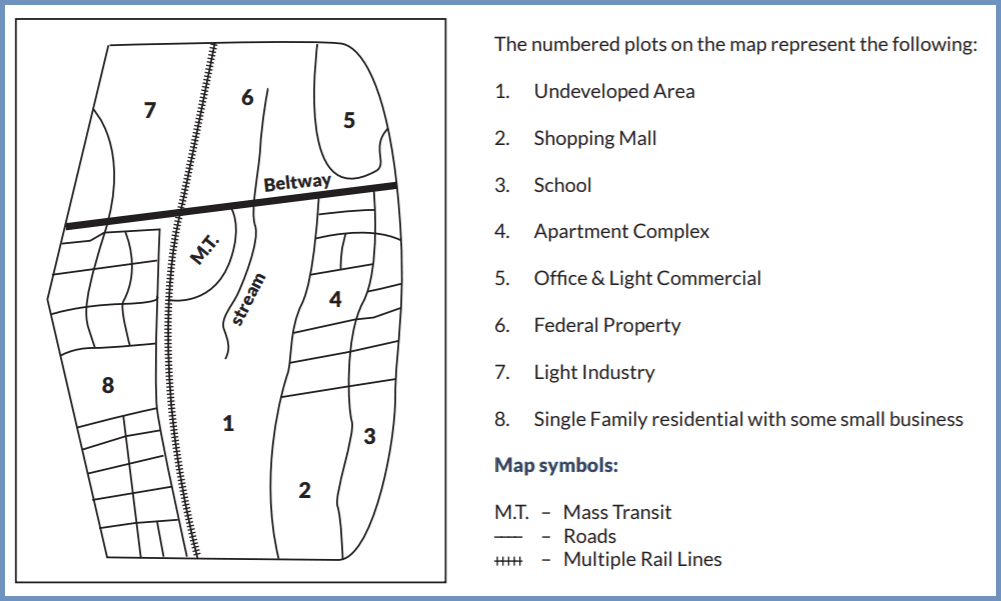 Once students have shown an understanding about smart growth and urban planning, they will receive the provided electronic mapping assignment sheet. This document includes a detailed map of a neighborhood with a new, donated plot of land. Students create a plan for the land that includes a proposal and a drawing of how they would use their smart growth knowledge to benefit the neighborhood. The map from the assignment sheet is also provided as a PNG, making it easy for students to digitally mark up the land in order to plan their neighborhood.
Groups should be prepared to present their smart growth plan to the rest of the class on a video platform. Presentations should include the plan, a picture of the proposed layout, short term and long term effects of the plan, and, if the teacher chooses, how the city will fund the development.
Apportionment and Redistricting Lesson Plan for High School Social Studies
The People’s House lesson plan has high schoolers investigate one of the most important effects of the census – reapportionment of congressional representatives and the drawing of congressional district lines.
In the first part of this lesson, students examine primary sources, both historical documents and modern articles, and debate the Permanent Apportionment Act of 1929, which capped the total number of members in the House of Representatives to 435. These sources are included as links in the lesson plan, as well as primary source documents, which help students summarize the challenging language of the Federalist Papers and a 1929 New York Times article arguing against House expansion.
Following their research, the lesson plan asks students to hold a debate, one side arguing for the repeal of the Permanent Apportionment Act, the other arguing to keep it instated. We recommend asking students to write persuasive essays outlining their position and reasoning instead of a traditional debate while distance learning.
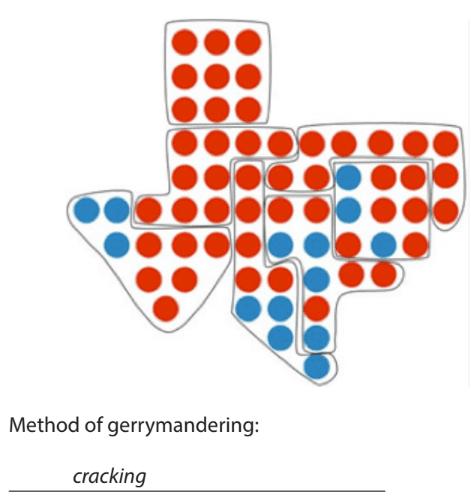 The next part of the lesson plan introduces students to gerrymandering – the process of manipulating district lines in order to benefit a group or party in an election.
Students will learn two tactics of gerrymandering, “cracking” and “packing,” and use these tactics to draw districts with different election outcomes on digital state maps. The map worksheet is an image file that students can open with paint or any basic image software, and mark up electronically with their proposed district outlines. The completed worksheet can be emailed to you or uploaded to your virtual classroom.
For more online gerrymandering resources, we recommend students play The ReDistricting Game, produced by the Annenberg Center.
Teaching the Census Online Can Be Easy!
We encourage you to visit our Census 2020 Webinar Google Drive folder and download any materials that might work for you and your students. Once you’ve downloaded these materials and saved your own copies, we encourage you to make any changes that you see fit. In fact, we’d love to hear about any modifications you make to fit the needs of your classroom!
Though distance learning has changed the venue for our learning opportunities, we want all teachers to be able to take advantage of an event that only comes along every ten years to make real-world connections between data and society for their students. We hope these electronic lessons and templates prove useful to you as we wrap up the semester and look into next year.
Happy learning, and if you haven’t done so already, don’t forget to fill out your census form!
Image credit: 1900 U.S. Census sheet (National Archives and Records Administration. 1900 U.S. Census, Wilmington Hundred, New Castle County, Delaware, SD 27, ED 6, sheet 2, pp 474 https://archive.org/details/12thcensusofpopu154unit/page/n473/mode/2up accessed 7 March 2020)