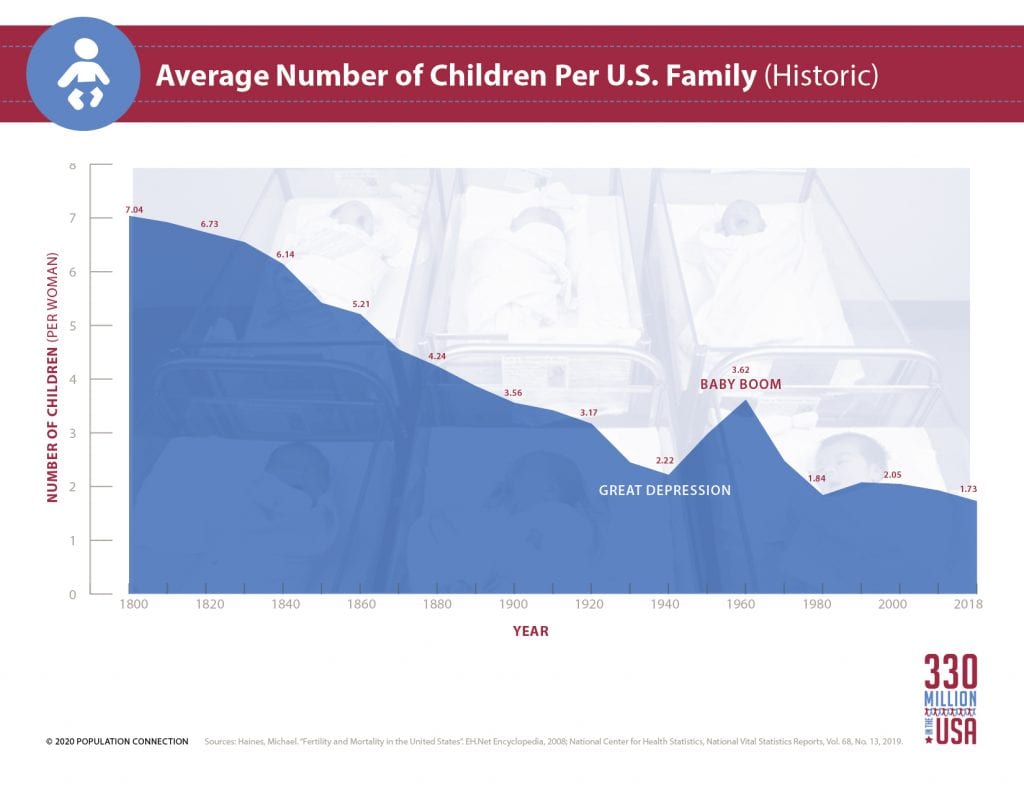
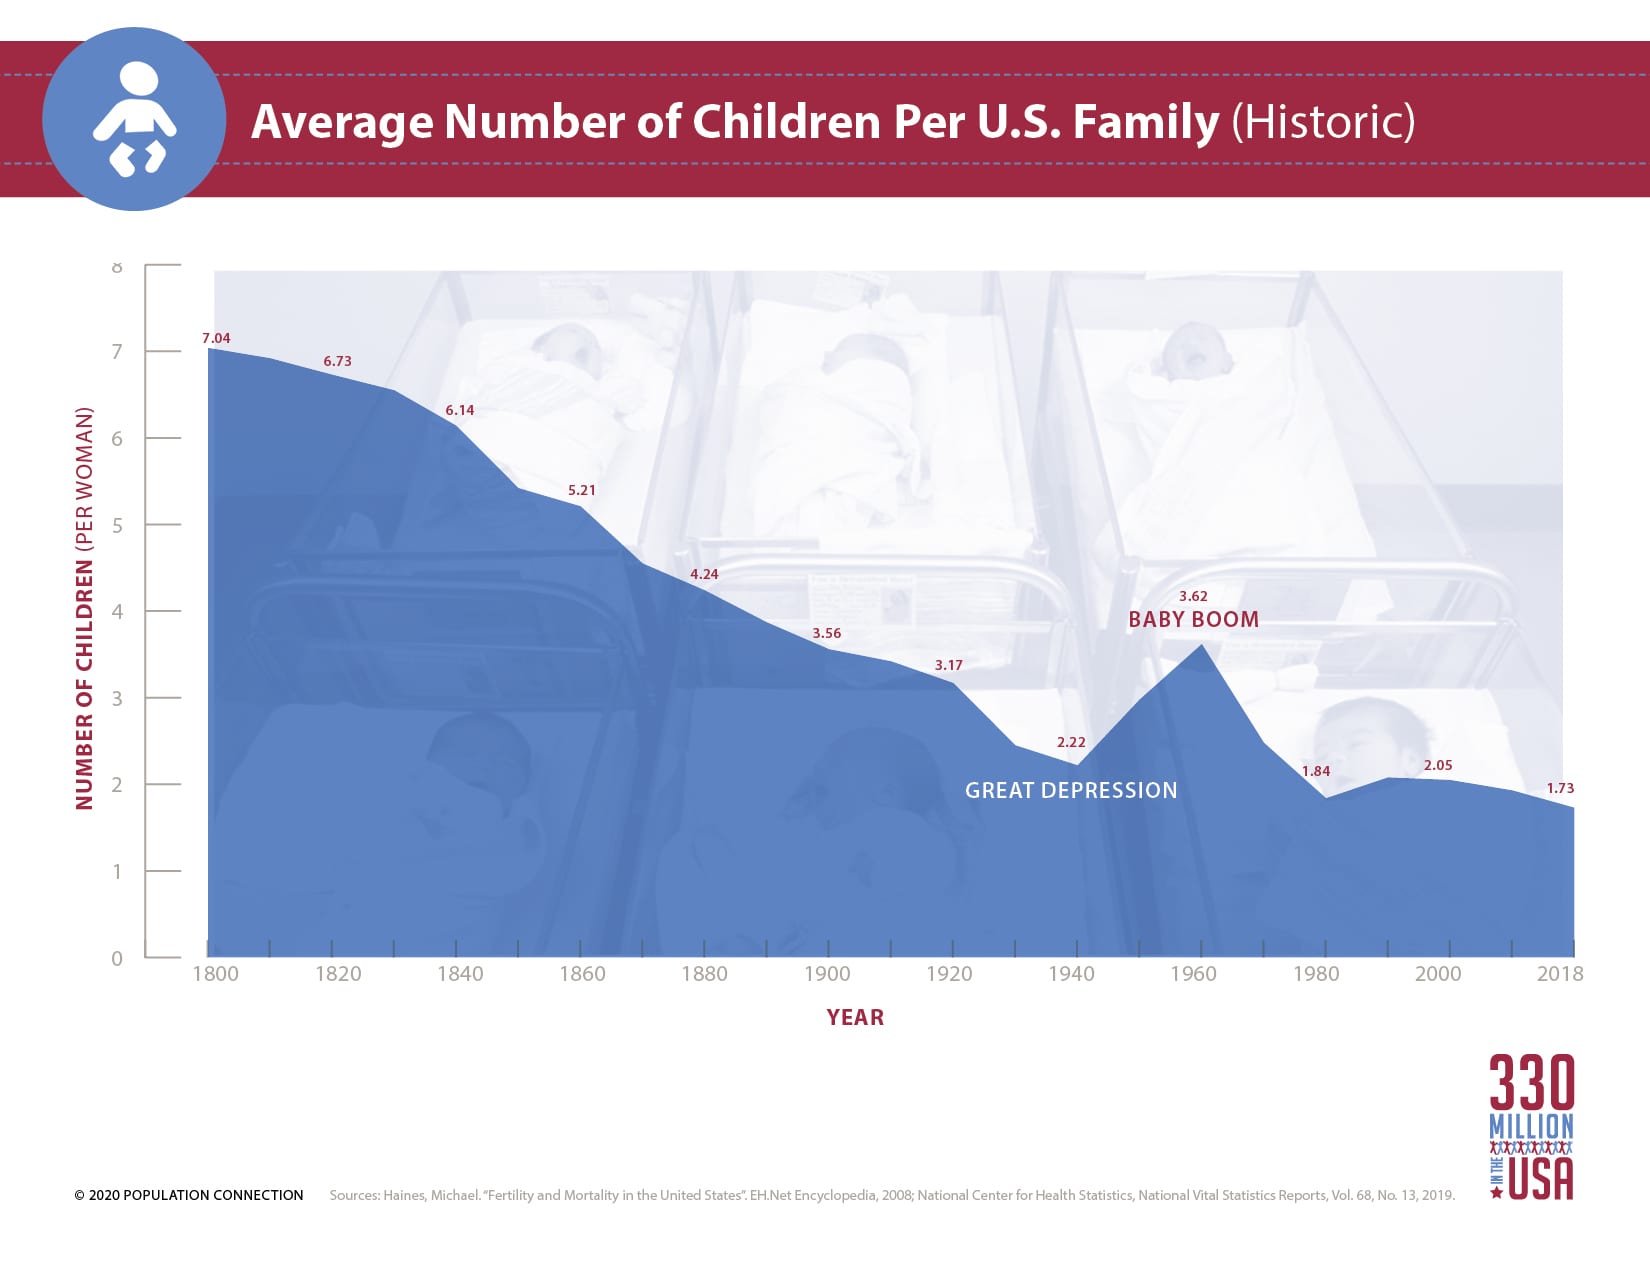
Line graph shows the average number of children per woman in the United States over time. In 1800, most women in the U.S. had 7 children but that number has steadily decreased over the years, with the exception of the Baby Boom (when the U.S. fertility rate jumped to 3.62). In 2018, U.S. woman had 1.7 children on average.
Data sources: Economic History Association; National Vital Statistics Report from the National Center for Health Statistics.
Graphic produced as part of the 330 Million in the USA lesson packet.
Other Resources You Might Like:

History of love and marriage in the U.S., including contraception, sex education, and family size.
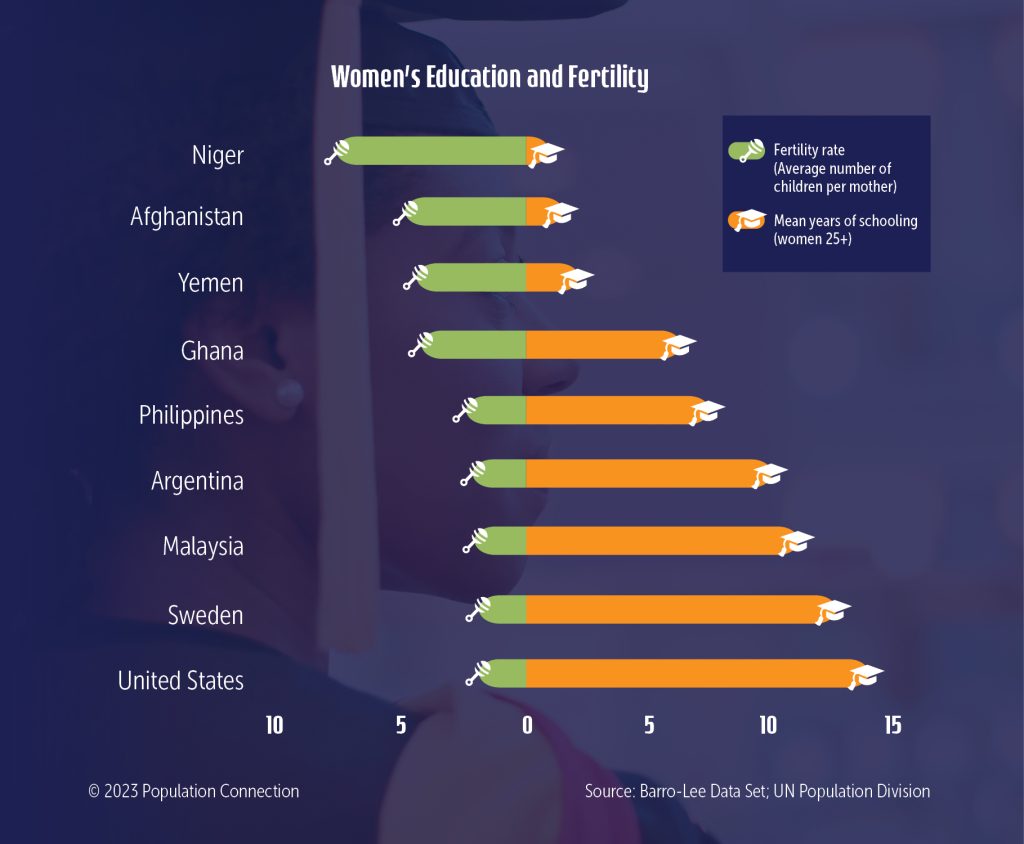
Graph displays the fertility rate and mean years of schooling for nine countries.
Nice to meet you!
Tell us a bit about yourself so we can continue creating resources that meet your needs.
You’ll only need to fill out this form once. If you’ve already completed the form, you can confirm your email here.