The sex identification on a population pyramid, or age structure diagram, typically reflects biological sex as assigned at birth, and can be different from an individual’s gender identity or current sex. The classic population pyramid divides a population by sex, male and female, and by age, grouping people into five-year age cohorts.
While population pyramids are excellent for visualizing a current population and gleaning broad demographic trends, they don’t leave room for non-binary and transgender people.
Data Underlying Population Pyramids
In order to understand the limitations of population pyramids, it’s helpful to understand limitations in the data behind them.
Census data and vital statistics are the primary sources for population pyramid data. Many countries conduct a census and survey of all people living within its borders every set number of years. Many countries also have a department of vital statistics or civil registration that tracks specific details about people living in the country throughout their lives. These agencies collect information on things like a person’s date and place of birth, date and cause of death, marital status, citizenship status, and date of arrival to or departure from the country.
Exactly what and when data is collected depends on the politics of the country. It also depends on the country’s financial capabilities, infrastructure, and stability. For example, Afghanistan, the Democratic Republic of the Congo, and Uzbekistan have not conducted censuses for over 35 years. Lebanon has not conducted a census in over 90 years. Around a quarter of the children born each year are born in countries with limited or no reliable vital statistics gathering. Where gaps in data exist, demographers fill them in with modeling, limited surveying, and extrapolating from past trends.
Vital Records in the United States
In the United States, the National Vital Statistics System (NVSS) stores this demographic data for every person. This data comes from individual states where rules about collecting and updating data vary. Information enters the system from many locations: health care professionals may report a birth, funeral directors may report a death, the courts might report an adoption, marriage, divorce, or change in citizenship status, the Department of State might report an American’s birth overseas. This data trickles up to the federal NVSS. Often a person’s sex identification (called a gender marker in the NVSS) comes from their birth certificate where it was assigned by the healthcare professional reporting the birth and then approved by the state.
Just because a country compiles vital statistics, doesn’t mean details are current or accurate. The process to change one’s gender marker in the U.S. is often arduous, time-consuming, expensive, and many times requires a lawyer. To change this data in the NVSS, Americans often change their name first in their local court system. Then they need to file paperwork to update their gender marker with the federal government. Finally, they need to update their gender marker with their state of birth (to change their birth certificate) and state of residence (to change their driver’s license). Each state has different rules, not all are easy to navigate, and some states (Florida and Kansas) have banned any updates to a person’s gender marker at all.
Census in the United States
The U.S. Census Bureau also gathers data that it uses to generate binary population pyramids. Many residents of the United States are familiar with the decennial census that attempts to collect basic information on every individual in the U.S. every ten years. The Census Bureau also conducts smaller surveys between decennial counts that gather more detailed information on a smaller number of households.
The most recent decennial census in the U.S. asked people to identify their current biological sex as only male or female. However, in 2021, the Census Bureau asked about sex assigned at birth and gender identity on a smaller House Pulse Survey. This was the first survey that the Census Bureau conducted that asked more nuanced questions about sex and gender. The American Community Survey, a much larger survey, looks poised to ask about sex assigned at birth and gender identity for the first time in 2024. This may be a test run of language that could appear in a future decennial census. However, the process of changing questions on the decennial census is long and political, and more detailed sex or gender identity questions look unlikely for the foreseeable future.
Vital Records and Census Around the World
It’s only relatively recently that any country has systematically gathered data about gender and sex identity. Nepal was the first country to include a third gender option in its official census in 2011, though the resulting data most likely undercounted this community due to structural census challenges and discrimination. Since 2011, other countries have incorporated non-binary gender identification options in their censuses including India, Argentina, and the UK. Some countries, like the U.S., only ask about gender identity in smaller surveys. Many more countries have updated their vital registration systems to include nonbinary gender markers: Germany, New Zealand, and Taiwan, among others. And in each of these countries, definitions of identity categories and the procedures for reporting and updating records vary significantly.
Canadian Census Includes Gender Identity
Notably, Canada conducted the first nationwide census (2021) with mandatory questions asking about sex at birth and gender identity. It is an interesting data set to consider while evaluating the binary population pyramid structure. The first question asked for an individual’s sex at birth with two options for answers: male and female. The second question asked for the person’s gender with the answer options: male, female, and “other, please specify.” Based on responses, Canada sorted people into five categories: Transgender Women, Cisgender Women, Transgender Men, Cisgender Men, and Non-Binary Persons (which included people identifying as agender, fluid, queer, and Two-Spirit, among others).
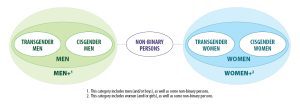
Canada still uses binary population pyramids to illustrate age and sex data, even though they have a more complex data set. In order to fit the five categories into the binary pyramid structure, Canada had to do some grouping. They note that this grouping is only for statistical purposes, and that it has the benefit of protecting confidentiality of individuals in some of these categories (which can be quite small). For the population pyramid, Canada created a Female+ category that includes transgender females and cisgender females. They created a Male+ category that includes transgender males and cisgender males. And non-binary people were divided equally between Male+ and Female+ at each age cohort.
Alternatives to Binary Population Pyramids
Is it possible to graph population data and represent a greater variety of identities? Canada still graphs their population on a binary pyramid using the Female+ and Male+ groupings. What if all identity categories were represented in that traditional pyramid structure? Canada’s pyramid might look something like this:
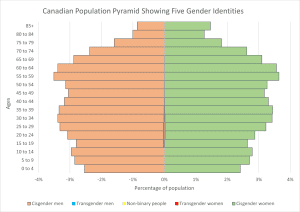
Note that publicly available data for transgender and non-binary Canadians starts at age 15, and all transgender and non-binary individuals 65 and older are grouped into the 65 to 69 age cohort.
But the percentage of people that fall into transgender and non-binary categories is so much smaller than the people identifying as cis-female and cis-male, and it is very difficult to see the data. These groups are more visible when you zoom in, as in the graph below.
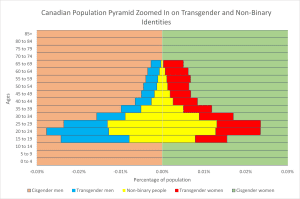
The challenge with including multiple gender categories in the traditional pyramid is how difficult it is to compare the different groups within one age cohort in a pyramid structure. In rows where there are five gender categories, none of the categories start at zero on the x-axis. As a result, it’s hard to tell the percentage of each category, or to easily see which group is larger or smaller than the others.
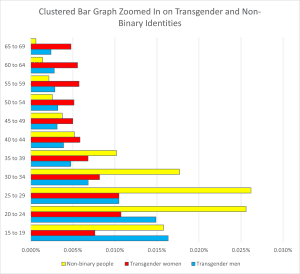
If we wanted to compare population trends for cis-females, cis-males, transgender, or non-binary people, a different structure may give more insights. A clustered bar graph retains half of the traditional pyramid shape (the y-axis is similar) while allowing a side-by-side comparison of the size of different groups (all gender categories start at zero).
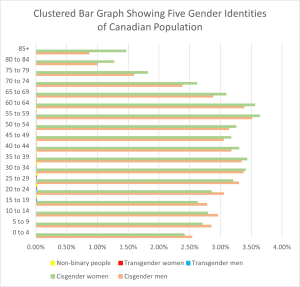
But again, the percentages of people falling into transgender and non-binary categories are overwhelmed by the percentage of people falling into the cis-male and cis-female categories. Isolating data on transgender and non-binary people can also help us zoom in to analyze and compare trends within specific identities.
What is the Most Effective Age Structure Diagram?
The most effective visualization of data would depend on the user’s goals. If the diagram is meant to compare the population in Canada to the population in other countries, then using the same binary pyramid format that other countries use allows for easy comparisons.
If the goal is to see how the Canadian population has changed over time, visualizing 2021 census data in the same binary format as previous years’ data makes comparisons easier. Try it yourself: visit the Canadian population pyramid, toggle the visualization from “comparison” to “historical,” and move the slider under the pyramid forwards and backwards in time.
If the diagram hopes to compare identity groups within a population, identify trends within these groups, or be used to make policy decisions that impact these groups, then using a different visualization, like a clustered bar graph, might be more informative.
Determining whether or not to use a binary pyramid depends on the goals of the data visualization. How is the data meant to be used and what story does it hope to tell? Binary population pyramids remain a powerful tool to compare general demographic trends across time and across countries, as long as users understand limitations in how data is gathered and where gaps may exist. And when the story becomes more complex, it becomes more important to explore other data visualizations.
Image credits: Gender identity grouping infographic (Statistics Canada, Figure 1: Filling the gaps: Information on gender in the 2021 census, April 6, 2022. Reproduced and distributed on an “as is” basis with the permission of Statistics Canada.


