



Understanding per capita consumption is critical when considering human impacts on the planet. That’s why the Next Generation Science Standards explicitly include per capita consumption in the Disciplinary Core Idea “Human Impacts on Earth Systems.” NGSS’s middle school standard MS-ESS3-4 asks students to “Construct on argument supported by evidence for how increases in human population and per-capita consumption of natural resources impact Earth’s systems.”
So, what exactly is per capita consumption and why is it so important in conversations about sustainability?
 What is Per Capita Consumption?
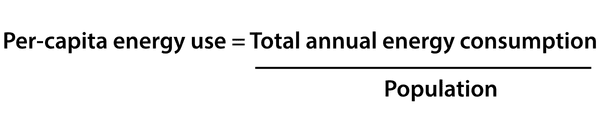
Per capita consumption is a measure of how much the average person consumes in a given population. It is found by taking the total consumption of a particular resource for the entire population, usually calculated over a year, and then dividing it by the total number of people in the population. In simple terms, it can be thought of as a “per person” measure.
When Are Per Capita Consumption Stats Used?
Per capita consumption can be calculated for a number of different resources – water, land area, energy, material goods, etc., and it can be found for any population. It is often calculated by country or region but can also be looked at on smaller scales like states or cities.
What’s Included in Per Capita Consumption?
While it sounds fairly straight forward to divide the total amount of a resource used by the size of the population, it can quickly get murky when you tease out exactly what the numbers include.
Let’s look at per capita energy consumption in the U.S. to get a deeper understanding of what’s really behind the number.
How to Calculate Per Capita Energy Use
To find per capita energy use, we’d take the total amount of energy consumed in the United States in a year (94 quadrillion British Thermal Units, or BTUs) and divide that by the total U.S. population (344,128, 444). The math gets tricky, but it works out to roughly 277 million BTUs per person annually.
But here’s where it gets murky: this equation isn’t limited to only how much energy the average person uses around their home, school, or job.
The “Hidden” Energy in Per Capita Energy Stats
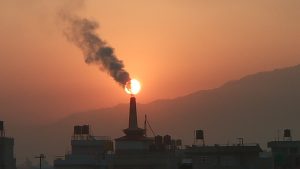
The per capita calculation also includes energy used for things like industrial production and agriculture. This energy consumption is more “hidden” to the average person – we might not have any idea how much energy goes into producing the food we eat, the clothes we wear, or the things we use every day.
So when we’re thinking about per capita consumption, it’s not just about the day-to-day actions of an individual, like switching off the lights or turning down the thermostat; it’s about how much energy our society uses as a whole. Per capita energy use is essentially one person’s “share” of the country’s entire energy footprint.
Why is Per Capita Consumption an Important Measure?
Per capita consumption gives us a deeper understanding of human impacts on the planet and how those impacts differ between populations. It would logically make sense that more people (or larger population sizes) tend to have a bigger impact on natural systems. But per capita consumption shows us that the story isn’t that simple. There are many places in the world with large populations but relatively low environmental impact.
Let’s continue with our energy example and compare the United States and India. India is the world’s most populous country, housing 1.4 billion people. The U.S. population is roughly a quarter of that, clocking in at around 344 million people. So following the “more people, more impact” logic, India should use more energy than the U.S. But that’s not the case.
Energy Use in the U.S. vs. India
India’s energy consumption amounts to just over 36 quadrillion BTUs while U.S. energy consumption is nearly triple that at 94 quadrillion BTUs, even with a significantly smaller population. Clearly, energy is being used differently in these two countries.
Calculating per capita consumption quantifies this difference in an easily digestible way – U.S per capita energy consumption is 277 million BTUs and Indian per capita consumption is roughly 26 million BTUs. Put another way, we could say the average American consumes as much energy as roughly 10 Indians.
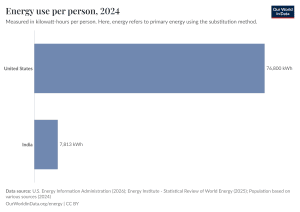
NOTE: 1 kwh = roughly 3,412 BTUs
Per Capita Consumption Shines a Light on High-Resource Lifestyles
Per capita consumption statistics help illuminate the resource intensity of lifestyles within a population. And again, we’re not just talking about how many lights are used in people’s homes (though that’s a part of it). It’s how much is being consumed by the country as a whole to produce goods, feed people, provide transportation, maintain industrial production, and more.
A low per capita consumption number indicates that less resources are used to support people and the overall environmental footprint is lower. A high per capita consumption number indicates more resources are being used to support daily life and the overall environmental footprint is higher.
Development and Per Capita Consumption
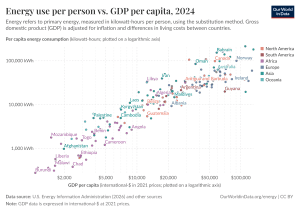
Generally, more developed nations have higher per capita consumption while less developed nations have lower per capita consumption. A deeper look at the energy landscape in India and the United States helps explain this pattern.
The average Indian’s energy consumption is so much lower than the average American’s for a variety of economic and structural reasons. One of the biggest reasons ties back to overall wealth. Generally, as a country’s wealth grows, their energy use also grows – they produce more, people consume more, diets shift toward more processed food, and people have more access to things that can improve quality of life like heating/cooling and other electric powered conveniences. While India’s wealth and per capita energy consumption has grown over the years, both indicators are still significantly lower than the U.S.
Other factors are also at play. The economic structure in India relies more on services and labor-intensive processes that don’t rely on electricity rather than on the manufacturing and machines that power the U.S. economy. And, while roughly 99% of the Indian population is now connected the electrical grid, infrastructure challenges mean that consistency and quality remain spotty, especially in rural areas, which limits total energy consumption.
These structures and systems in place at the societal-level, and the differences between them, are at the heart of the energy divide between more and less developed countries.
Teaching About Per Capita Consumption
There’s a lot to unpack when it comes to teaching about per capita consumption but don’t let that stop you! Things like footprint calculators are a fun tool for exploring per capita consumption, sparking interest and leading to deeper, meaningful conversations.
And with per capita consumption relating directly to students’ daily lives, it’s an easy way to foster motivation and engagement while covering the NGSS standards.
Per Capita Consumption Lessons Are Great for Interdisciplinary Teaching
Moreover, studying per capita consumption naturally integrates math skills and is a powerful way to integrate across content areas. The following PopEd lessons will make it seamless and fun to cover per capita consumption in your classroom:
Watch Your Step!: Students take an online ecological footprint quiz to determine their resource use and test how changes to their daily actions impact its size.
How Much Space Do We Need?: Through research and analysis of their consumption of renewable resources, students measure the amount of land that they would need to support themselves.
Carbon Crunch: Students use country-level data to compare where carbon dioxide emissions are produced to where people are most vulnerable to the effects of climate change.
Per Capita Consumption FAQ
What is per capita consumption?
Per capita consumption is the average amount of resources, goods, or energy consumed by one person in a population over a specific period of time. It is commonly used to measure resource use and environmental impact.
What is the meaning of per capita consumption?
The meaning of per capita consumption is “consumption per person.” It measures how much of a resource the average individual uses within a population.
How is per capita consumption calculated?
Per capita consumption is calculated by dividing the total consumption of a resource by the total population. This creates an average “per person” consumption figure.
What is the definition of per capita consumption?
The definition of per capita consumption is the total use of a resource divided by the total population to determine the average consumption per person.
Why is per capita consumption important?
Per capita consumption helps give nuance to country-level consumption statistics by helping to explain how societal systems and human lifestyles impact natural resource use and environmental impact. It also highlights differences in consumption patterns between countries and populations.
What does a high per capita consumption rate mean?
A high per capita consumption rate means that more resources are being used to support daily life, production, transportation, and economic activity within a population.
How does per capita consumption affect the environment?
Higher per capita consumption generally leads to larger environmental footprints, increased energy use, and greater pressure on natural resources and ecosystems.
What is the difference between population size and per capita consumption?
Population size measures the number of people in a region, while per capita consumption measures how many resources each person uses on average. Both factors influence environmental impact.
Image credits: Hands under faucet (ID 133566373 © Sarawut Wiangkham | Dreamstime.com); Factory air pollution (Mahalaxmi Municipality, CC BY-SA 4.0, via Wikimedia Commons); Bar chart (Energy use per person, 2024 by Our World in Data is licensed under CC BY 4.0); Scatter plot (Energy use per person vs. GDP per capita, 2024 by Our World in Data is licensed under CC BY 4.0)