


Resource Overview
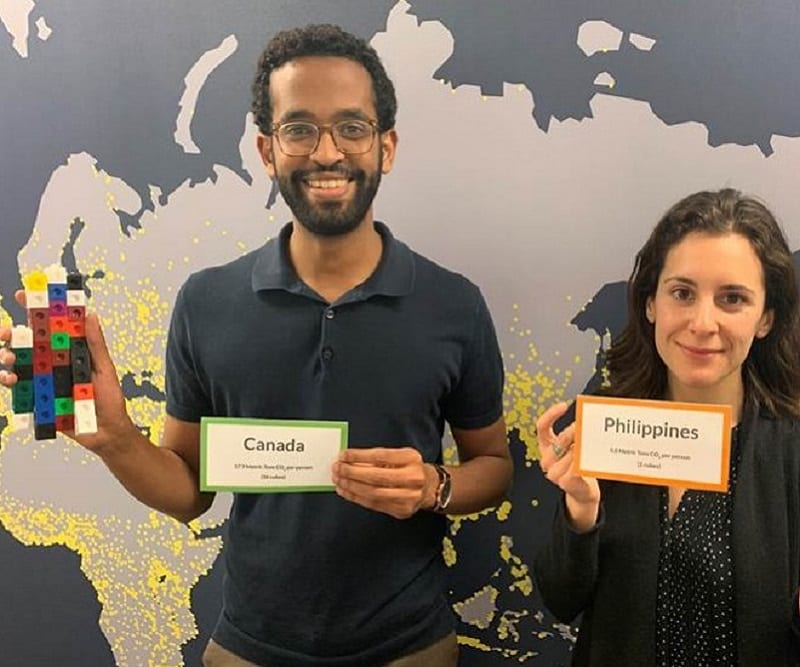
Students use country-level data to compare where carbon dioxide emissions are produced to where people are most vulnerable to the effects of climate change.
Students will be able to:
-
- Compare countries in terms of their per capita carbon use and their risk for experiencing climate change related disasters.
- Identify and analyze social, economic, and environmental factors that affect a country’s risk and adaptive capacity relating to climate change impacts.
Features of This Resource
- Global environmental justice lesson
- Students explore the human dimension of climate change
- Technology component when students explore interactive online maps

How Do I Get This Lesson Plan?
The resource is free. Click the green button for immediate download. Download Now
Other Resources You Might Like:
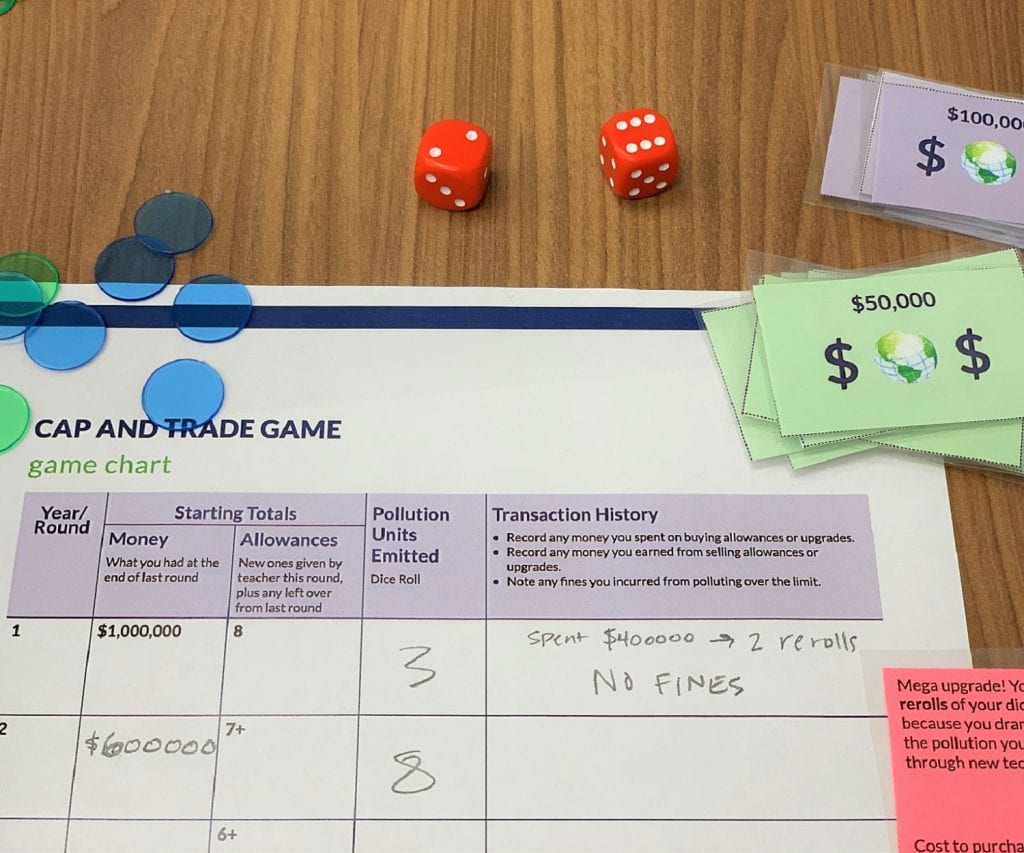
Students play a game that simulates a cap and trade system, and analyze its successes and weaknesses as a policy to reduce emissions of pollutants and greenhouse gases.
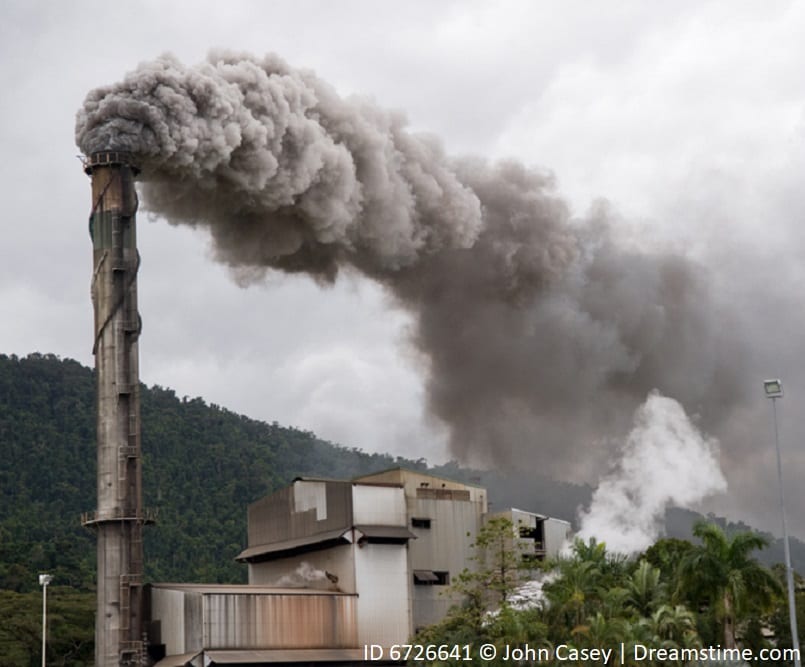
Students find articles about air pollution issues and use the information to create a class cause and effect chart of... Read more »
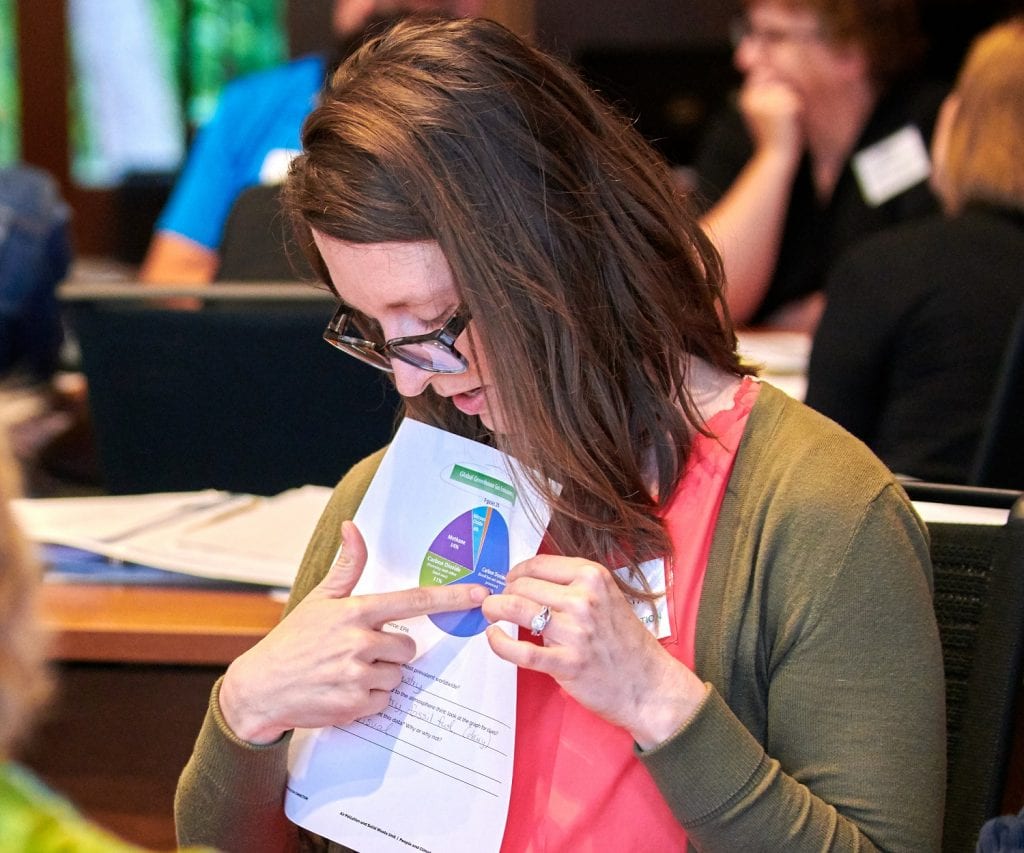
Students interpret various forms of data (graphic, written, and visual) and identify relationships between factors of climate change.
Nice to meet you!
Tell us a bit about yourself so we can continue creating resources that meet your needs.
You’ll only need to fill out this form once. If you’ve already completed the form, you can confirm your email here.