We all know that living things need resources in order to survive. We often, however, don’t make the connection that the amount of available resources dictates the size of a population – that a population will grow when resources are in surplus, decline when resources are scarce, and stabilize when the population is at the maximum level that can be sustained.
Making this connection between resource availability and population growth patterns is encompassed in the study of carrying capacity. Carrying capacity is taught in middle and high school biology classrooms around the world and is a crucial concept in the study of population.
Because the study of carrying capacity can be complex, it can help to first think of the concept in familiar terms. For instance, you may have seen the phrase “carrying capacity” posted on the side of a school bus. And in fact, “carrying capacity” in reference to a school bus or an elevator is not all that different from carrying capacity in reference to a population. On a school bus, the carrying capacity would be the maximum number of people that could safely fit. In ecological terms, carrying capacity is defined as the maximum number of a species that can sustainably live in a given area. In other words, a population’s carrying capacity is the size at which a population can no longer grow due to lack of supporting resources. All populations have a carrying capacity, whether bacteria in a bottle or rabbits in a forest. If we were referring to a rabbit population in a forest, the carrying capacity would refer to the maximum rabbit population that can be supported by that forest’s resources.
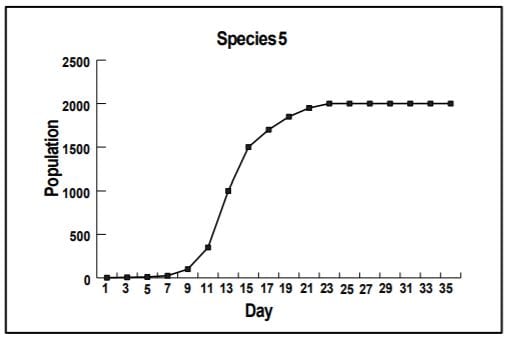
Biologists often graph populations to show growth trends. A graph that reveals an “s” shape indicates that the population has hit its carrying capacity. For example, in the graph pictured above (taken from the activity, Pop Ecology Files), we can see that the population of this particular species was growing until day 23, and then leveled off at a carrying capacity of 2,000.