PopEd’s World Population DVD recently got even better. First produced over 40 years ago, the video is still as eye-popping as it is educational, offering a visual animation of human population growth from 1 CE through 2050. But the new 2015 World Population boasts more accurate dot placement and can be interactively explored using the new accompanying website, World Population History. Let’s take a peek behind the scenes at what went into updating this award-winning teaching resource…
Determining early population numbers: Population estimates from ancient times are constantly being revised. As such, we decided to revisit when and where dots were placed in the early years of the video. Unlike more recent years, where population counts can often be drawn from a country’s census data, early population numbers are essentially estimates based the research and interpretation of historians. Without hard data, it’s no surprise that there is significant variation between demographers’ “best guesses” of early populations. We used a compilation of sources to determine the timing and location of population dots.
ESRI’s ArcGIS software: After deciding where and when dots needed to appear, they had to be accurately placed on the world map. We achieved this task using ESRI’s ArcGIS, an easy-to-use platform for geographic information systems. With this program, we were able to plot the exact geographic coordinates (latitude/longitude) for each population dot and tell the program when dots should appear and disappear from the screen. The animation includes over 9,500 dots and we were thankful that ArcGIS was not only user-friendly, but also able to handle such a large capacity of data.
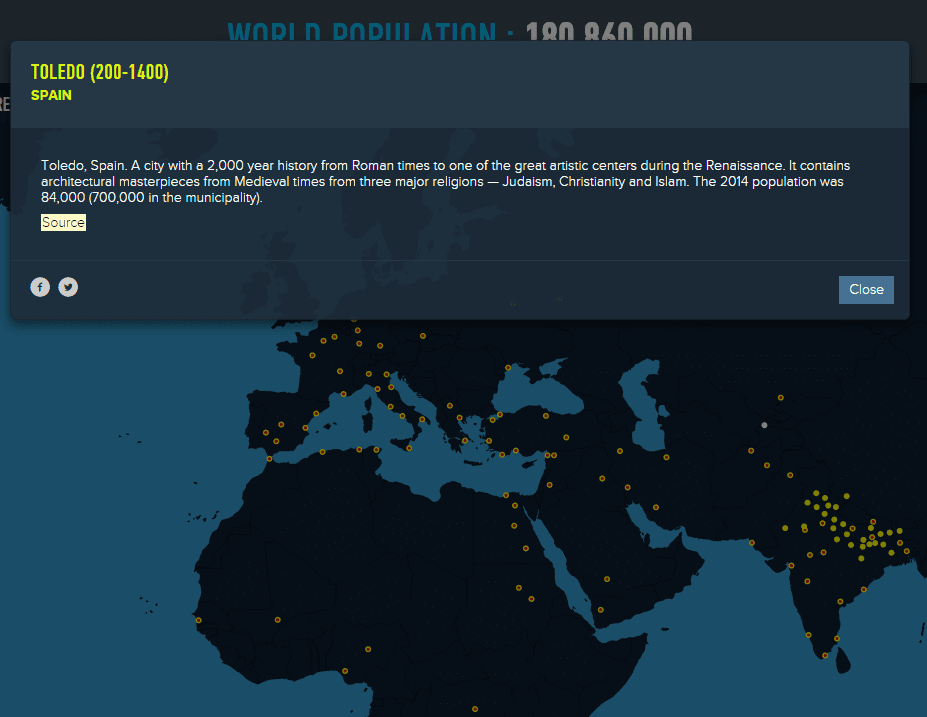
Annotating the dots: Lastly, to tell the story behind the dots, we built the World Population History website so that users can interact with the video. Over 4,000 of the population dots are annotated with relevant historical and demographic information. Users can zoom in to read annotations that cover a variety of topics: significant historical events that impacted population, population numbers for particular time periods, and interesting facts about the cities and regions that the dots represent. To maintain accuracy, we referenced historical and census data from individual country websites whenever possible.
These changes and more went into creating a final product that will be an invaluable teacher resource for years to come. Check it out at World Population History.