 The data is unambiguous: the world’s urban population is responsible for at least 70 percent of all global carbon dioxide emissions. The UN’s most recent World Urbanization Prospects estimates that at least 68 percent of the world population will live in cities by 2050, making urban populations’ CO₂ emissions one of the most pressing issues we must address to curb our overall carbon output.
Yet looking more closely into the data and definitions surrounding urbanization paints a different story than the big picture may suggest. In fact, urbanization may be one of our best tools to lower our collective carbon output, but only if that development occurs in thoughtful, sustainable ways. With the trend toward urbanization unlikely to go away, dense urbanization with thoughtful planning is critical to reducing greenhouse gas emissions worldwide.
What Are We Talking About When We Talk About Cities?
Our understanding of what an “urban area” is differs significantly depending on where in the world you are. Japan, for instance, defines an urban area as one with more than 50,000 inhabitants; in Denmark, that threshold falls to only 200 people. Some countries may add additional population density requirements, further complicating what counts as urban. Comparing urban populations across countries and even within countries therefore involves many different types of places. How can we compare the experiences of people in a tiny Danish hamlet to those of people living in dense Tokyo neighborhoods like Shibuya or one of the most densely populated global cities?
Not All Urbanization is Created Equally
Labeling all of these areas as “urban” masks major differences in the effects of different urban areas. In the Global North where the vast majority of carbon emissions occur, low density, sprawling suburban populations contribute most highly to global carbon emissions. Dense urban areas have lower carbon emissions even than rural residents. As cities grow denser, carbon emissions decrease across all land use types.
Take this map of carbon emissions by US zip codes published by UC Berkeley. Looking at the DC metropolitan area shows a curious effect: the core of the city in the District and its inner suburbs show lower carbon emissions than the national average. As we spread out to farther flung suburbs and exurbs, carbon emissions skyrocket to higher than the national average. This pattern persists across metropolitan areas throughout the United States and is seen in wealthy nations across the world.
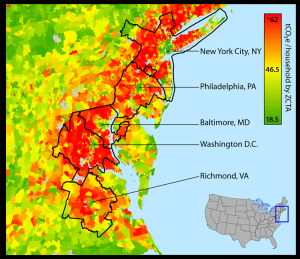
UC Berkeley CoolClimate Network, Average Annual Household Carbon Footprint – Eastern US (2013)
Why Are Carbon Emissions Lower in Cities?
Why does this happen? There are a number of factors in urban cores that reduce emissions, including less car usage, smaller household footprints, and fewer land use changes in already-developed cities. When people use public transportation instead of private vehicles, per capita greenhouse gas emissions decrease by two-thirds. Housing in buildings with five or more units, like apartment buildings, use half as much energy as other types of homes. And increasing building density in existing urban spaces avoids the land use changes that destroy carbon sinks like forests when urban development is sprawling.
These emission reductions are most effective in cities with established climate action plans, where reducing carbon emissions is an explicit goal of city policy and development. Climate action plans integrate emissions reductions into all elements of a city’s development and develop evaluation systems to track how successful emissions reductions have been across sectors. Climate action plans can be incredibly successful: since adopting a climate action plan in 2005, Copenhagen’s emissions have fallen by over 80 percent.
Urban Density Can Lead to Lower Emissions
Building dense cities is only one factor in reducing urban CO₂ emissions, and not all dense cities are created equally. Consumption patterns in the Global North and even within the Global North still create massive disparities in where carbon emissions are most prevalent. But urban density shows us how living in cities is not incompatible with long-term sustainability. It’s a matter of building cities with an eye on the future to meet the needs of people and the planet.
Key Insights on Population Density and Carbon Emissions
Factor / Topic |
Effect on Carbon Emissions |
Examples / Notes |
|
Urban population |
Responsible for at least 70% of global CO₂ emissions | UN World Urbanization Prospects estimates 68% of world population will live in cities by 2050 |
|
Definition of urban areas |
Varies by country | Japan: >50,000 inhabitants; Denmark: >200 inhabitants |
|
Density vs. emissions |
Higher density → lower emissions | Core of DC and inner suburbs show lower emissions than national average; farther suburbs/exurbs higher than national average |
|
Transportation |
Less car usage → lower emissions | Using public transport instead of private vehicles can decrease per capita emissions by two-thirds |
|
Housing |
Buildings with 5+ units → lower energy use | Apartments use half as much energy as other types of homes |
|
Land use changes |
Avoiding development on new land → preserves carbon sinks | Dense urban areas prevent land use changes that destroy forests |
|
Climate action plans |
Reduce emissions effectively | Copenhagen: emissions fell over 80% since adopting a plan in 2005 |
Image credits: New York City (‘Downtown is where it’s at’ United States, New York, Empire State Building, View From the Top of the Rock” by WanderingtheWorld (www.ChrisFord.com) is licensed under CC BY-NC 2.0); Emissions map (UC Berkeley CoolClimate Network, Average Annual Household Carbon Footprint – Eastern United States (2013))