
While migration on a global scale garners the bulk of media attention, migration within the United States plays an important part in understanding population trends. This “internal migration” is the movement of households from one address to another address within the same town, county, state, or between states without leaving the country. The U.S. Census Bureau estimates that about 14% of the people living in the U.S. move within the U.S. each year. This type of movement is driving changes in population across the nation.
How is Internal Migration Measured?
There is no simple way to measure internal migration, but there are several sources that paint an interesting picture about the internal migration within the United States. Moving companies like North American Moving and United Van Lines gather data on customers moving to and from different states. The Internal Revenue Service connects home addresses with social security numbers and can be used to track where taxpayers live at the end of each year. Every three months, Equifax compares addresses of everyone with a credit report, and can track migration quarterly. All of these sources tell interesting stories about internal migration. They also have significant gaps: disproportionately undercounting lower income movers, the elderly, young adults, people without social security numbers, or people without a credit history.

Most demographers and economists turn to the Census Bureau and the U.S. Bureau of Labor Statistics for information on how people are moving within the US. Every year, the Census Bureau surveys around 75,000 households to ask information about income for the Current Population Survey’s Annual Social and Economic Supplement (CPS ASEC). This data can be used to determine regional and nation-wide trends in internal migration. They also track state-to-state and intrastate moves as a part of the annual American Community Survey (ACS) of around 3 million households. This data set does not track all movers, and the ACS survey that targets county-to-county moves within states only happens every five years. Despite these limitations, the Census Bureau’s surveys are the oldest, most consistent data set for comparing trends in internal migration over time.
Why do People in the U.S. Move?
According to the ACS, the majority of movers in the United States relocate in order to improve their housing situation: they change to a preferred neighborhood, move from a rental to an owned home, or move out of someone else’s household to create their own new household. The next largest group moves because of family reasons like divorce or marriage. The third largest category of movers relocates for a job. With these as the primary drivers, here some trends in internal migration within the United States.
[Interested in learning about US migration over time? Check out our article about the history of internal migration in the United States.]
7 Recent Trends in Internal U.S. Migration
The Census Bureau’s 2018 Current Population Survey and American Community Survey data highlighted a handful of trends in how people are moving within the United States:
- Internal migration rates are at an all-time low since the Census Bureau began the CPS surveys in the 1940s. Moves dropped off significantly during the Great Recession and have stayed low since.
- Of everyone that moves within the U.S., most are local moves within counties, rather than across states or between states.
- In general, the states in the Northeast and Midwest are seeing a net negative internal migration rate. More people are leaving these states than are entering these states.
- Sun belt states in the southern U.S., in general, are seeing a net influx from internal migration.
- Some of the country’s largest cities are also seeing a net negative internal migration rate. Places like New York, Los Angeles, and Chicago would be shrinking, except for the influx of migrants from other countries.
- Larger cities that are seeing urban growth tend to be located in southern states, like Phoenix, Las Vegas, and Jacksonville.
- More people are moving out of cities and into suburbs, smaller towns, and rural areas than are moving into urban areas.
Even though there is a net negative internal migration in many regions of the country and in urban areas in general, these places are not shrinking. International migration makes up for the deficit. Many of these areas are seeing growth overall due to immigrants from abroad.
Internal migration plays an important part of shaping our nation, and all of these data sets give glimpses into population trends within the United States. The 2020 census will add an even larger dataset to the conversation, and will reveal even more about the changing face of our nation.
Resources to Continue Exploring:
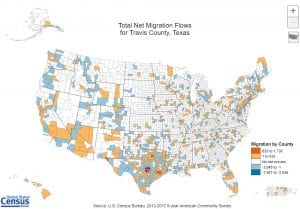
The U.S. Census Bureau has several interactive maps to explore. This map allows you to change characteristics to see how different kinds of people move around.
www.census.gov/programs-surveys/sis/resources/visualizations/flows-map.html
An ArcGIS map designer used IRS taxpayer addresses to illustrate internal migration with these unique flow maps.
www.esri.com/arcgis-blog/products/arcgis-online/mapping/visualizing-population-migration-by-where-people-filed-their-taxes
Forbes migration map allows you to pick a county and see a color-coded graphic of where people from that county moved from or moved to.
www.forbes.com/special-report/2011/migration.html
Image credits: Moving supplies (Rachel Spauldilng from FreeImages); Travis County migration map (Census Flows Mapper from U.S. Census Bureau)