The Demographic Transition Model (DTM) predicts changing birth, death, and population growth rates as countries industrialize. As a model, it can be helpful to understand and anticipate population trends in countries around the world. But like all models, the DTM has its limitations.
The first four stages of the DTM were originally described in the early 1900s and are modeled on the changing birth and death rates of England and Wales. This 4-stage model reflects a demographic pattern seen among Western European nations and the U.S. since the Industrial Revolution. As such, the DTM assumes that all nations will progress through each of the stages in turn as a country develops economically and socially. However, it stands to reason that not all countries would industrialize in the same way that Europe and the U.S. did, and that birth and death rates might not follow the same patterns.
Here are four examples of limitations of the DTM with case studies to illustrate each.
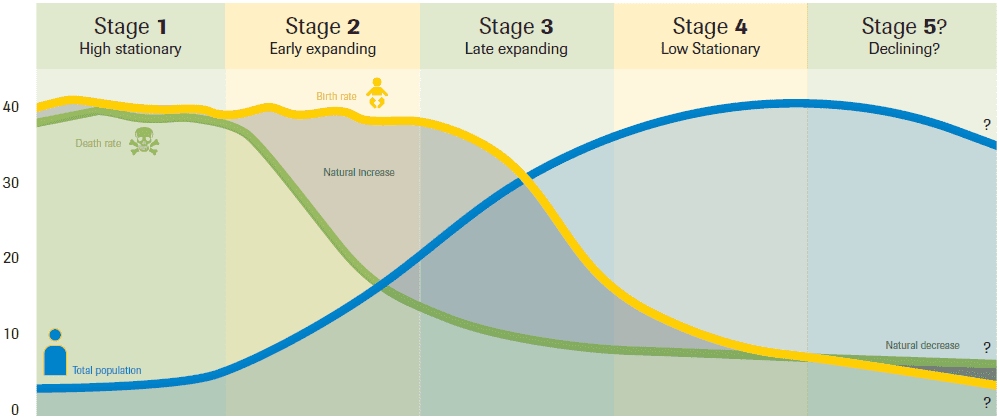
The 5th Stage of the Demographic Transition Model and Beyond
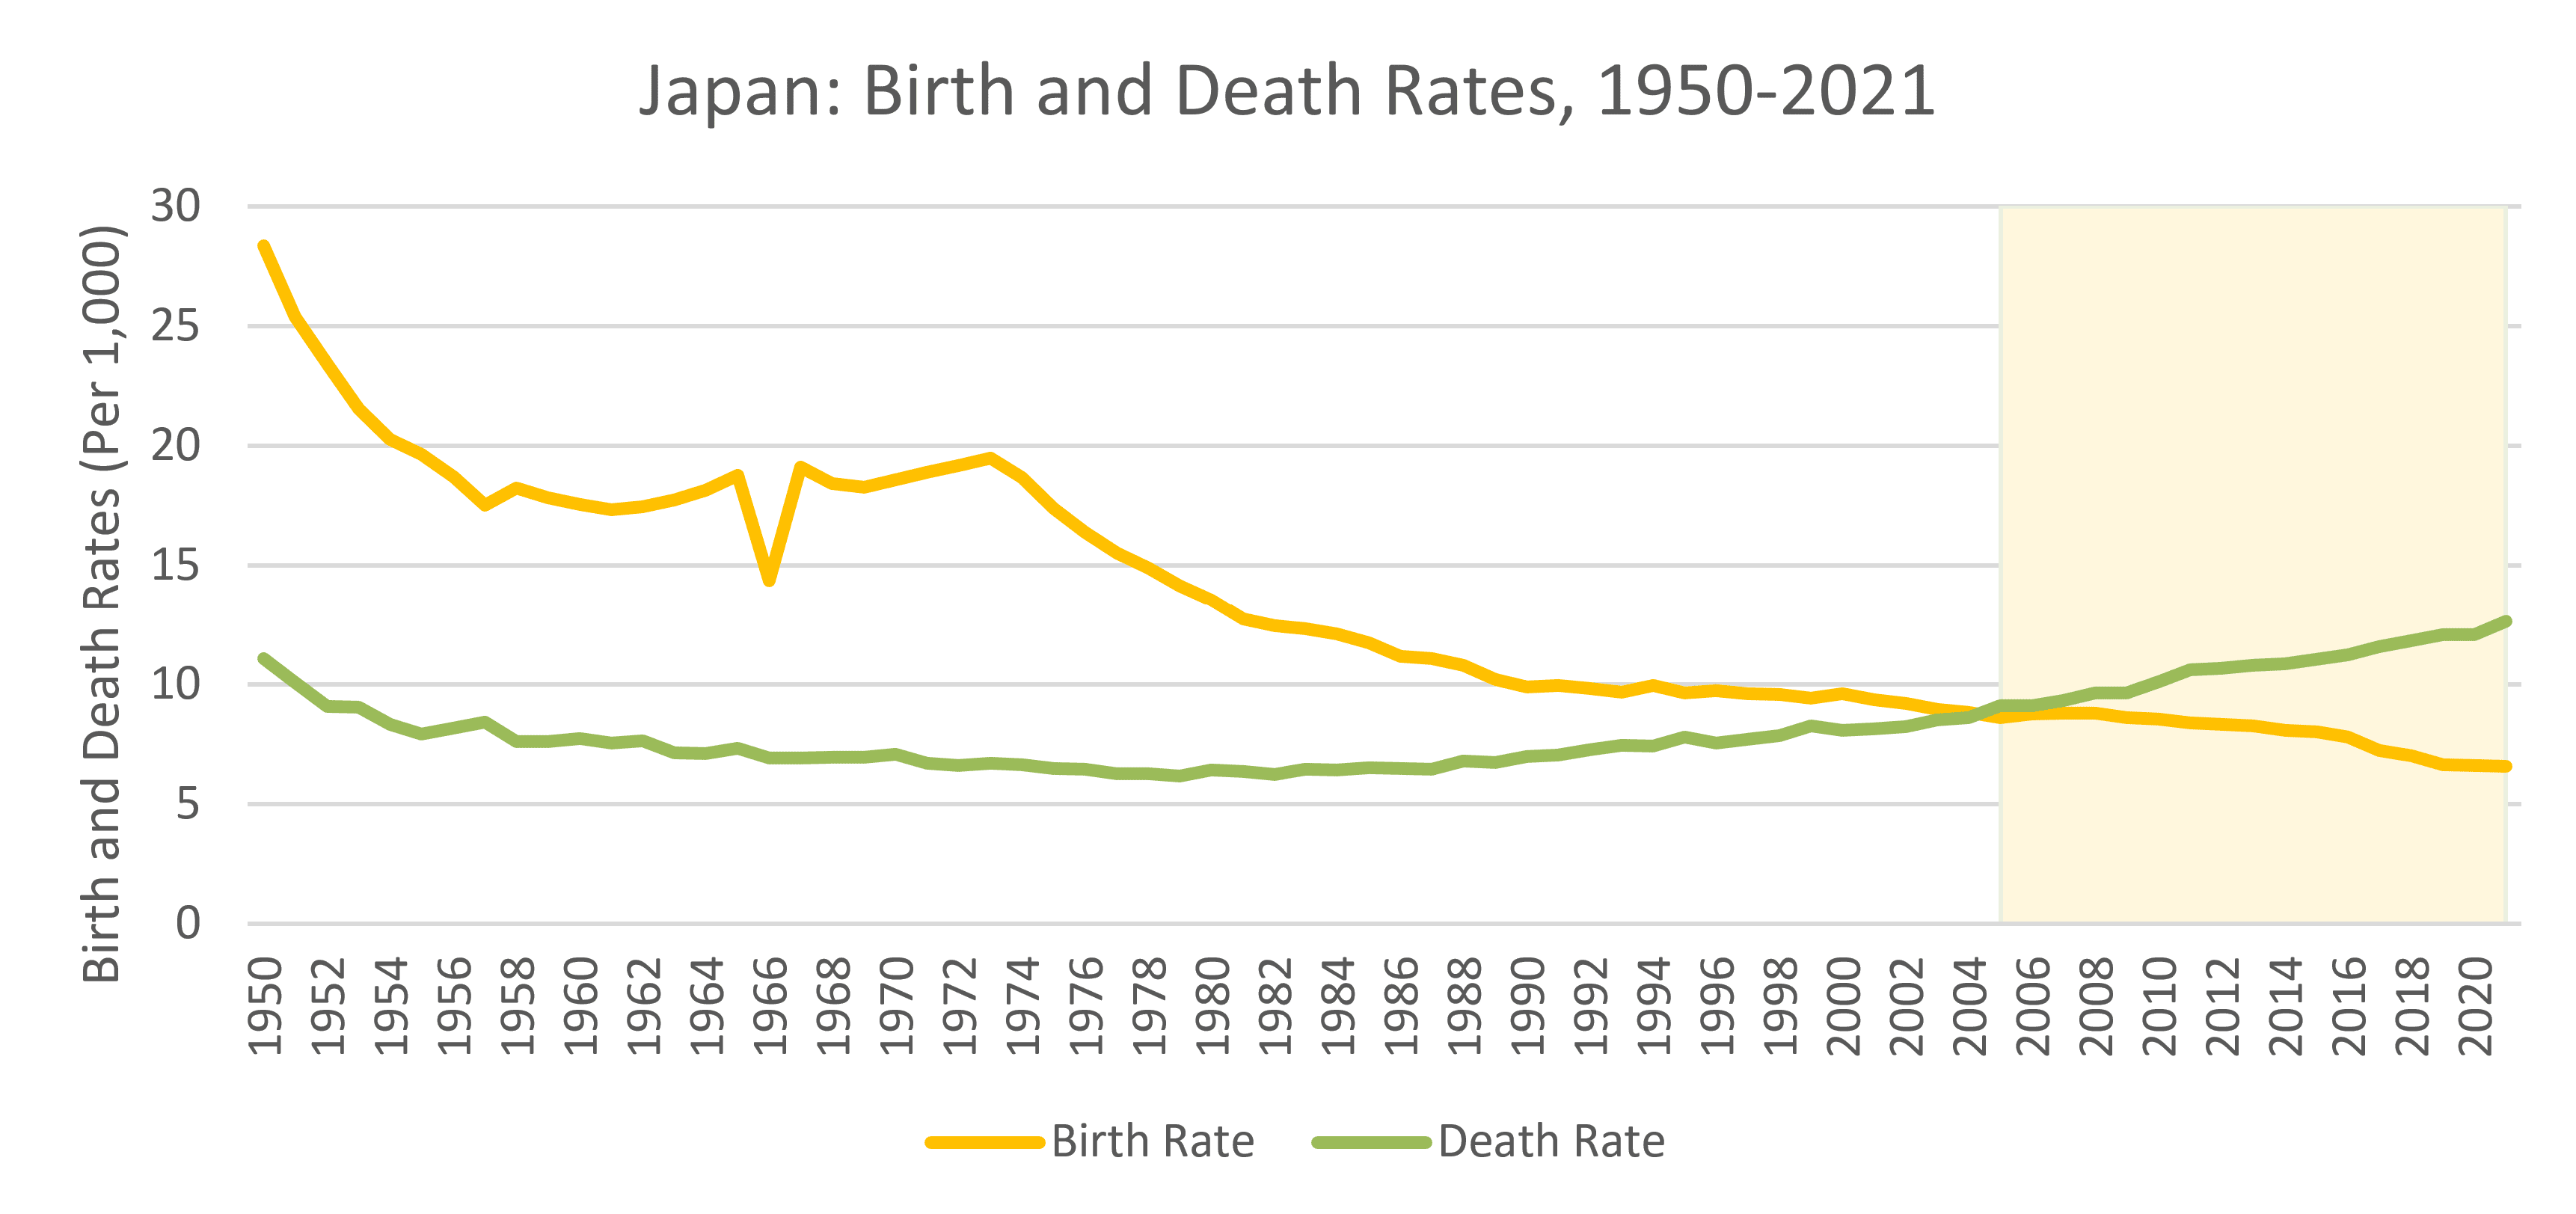
The original DTM anticipates four stages of changing birth, death, and population growth rates. By stage 4, birth and death rates are equally low, and population growth stabilizes. Many demographers now suggest that a stage 5 follows the original 4 stages of the DTM. In stage 5, birth rates fall below death rates, and total population declines. Japan may be in this stage, as shown in the highlighted part of the chart below. But what happens next? If the DTM is meant to predict future population trends, then it does not serve a purpose for countries like Japan that are currently in the final stage. Stage 6 is hypothetical at this point, and even stage 5 isn’t completely agreed upon.
Emigration and Immigration: A Closer Look At Germany’s Population
The original 4-stage DTM also does not take into account migration. Look at Germany, for example. Since the early 1970s, the death rate exceeds the birth rate. We would expect to see Germany’s population decline after several decades. Yet we continue to see an increase in the total population. The population increase is due primarily to immigration into Germany rather than from folks being born inside the country.
In the chart below, the purple columns represent the impact of net migration, or immigration minus emigration, on the total population. The orange columns show the impact of natural increase, or the birth rate minus the death rate, on the total population. Since the 1970s, natural increase has been negative with more deaths than births (the orange bars are below the y-axis). Notice that in recent decades, the total population increases during times of high immigration (like 1983-1992 when the purple bars reach high above the y-axis) and stagnates or decreases during times of lower immigration (early 2000s).
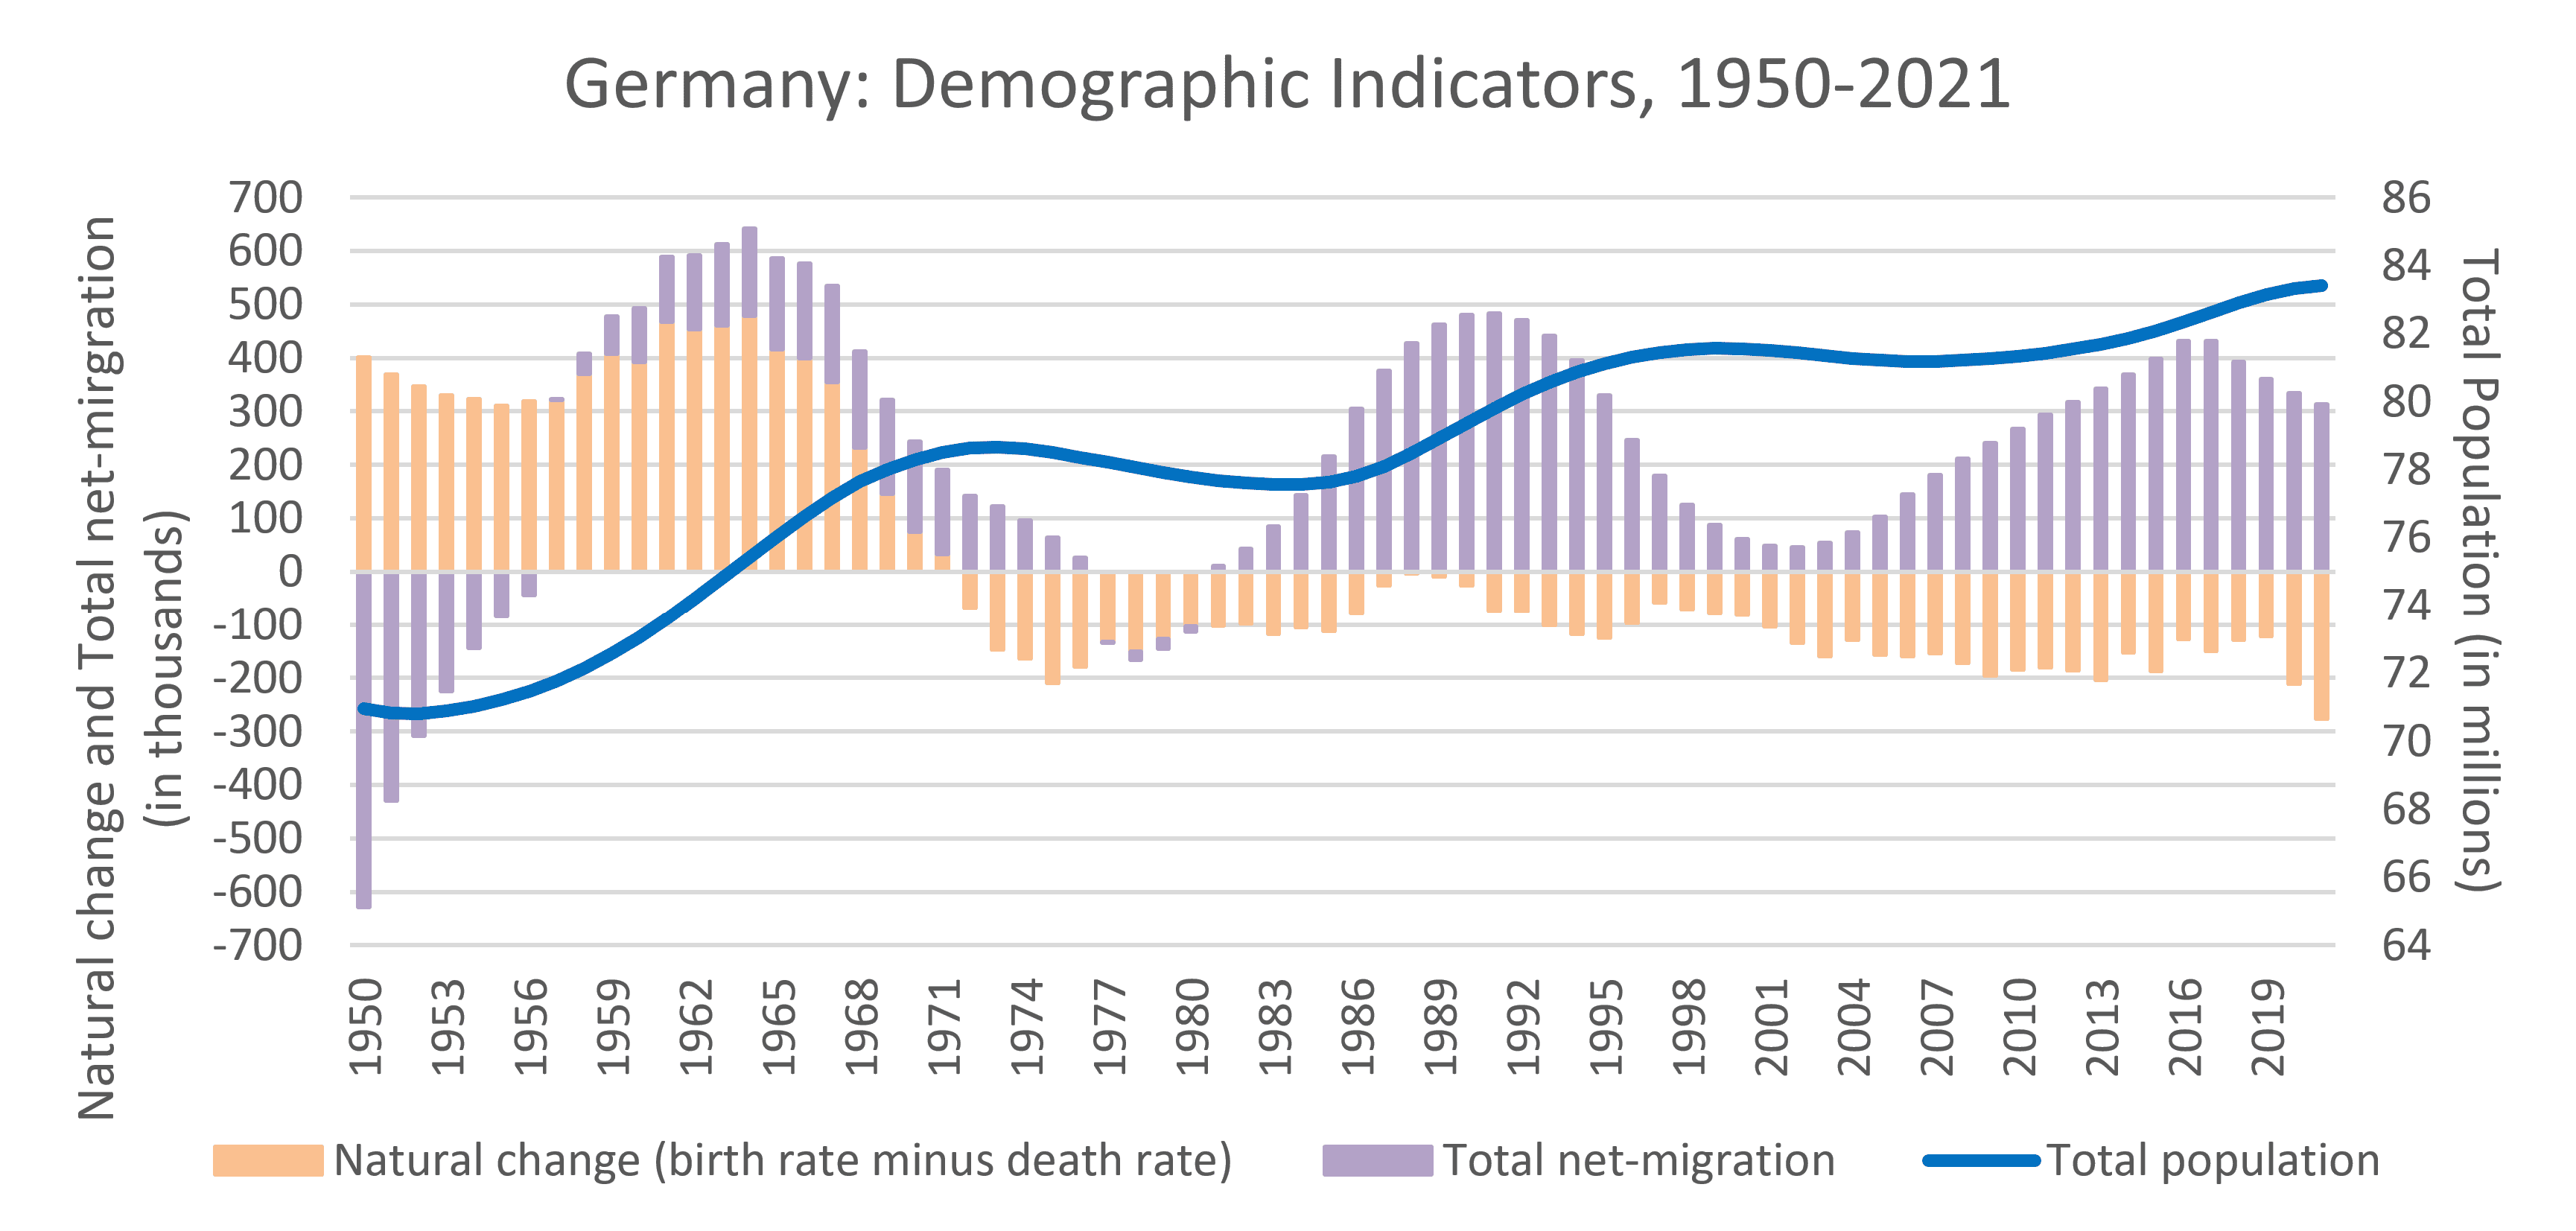
If we categorize Germany’s place in the DTM based solely on birth and death rates, we might place Germany in stage 5. But with an increasing overall population, it could be argued that Germany should be stage 4 of the DTM instead.
Global Pandemics and Climate Change
The demographic transition model does not take into account large-scale global challenges like pandemics or climate change. These events disrupt industrialization and have critical impacts on birth, death, and migration trends. Countries may find themselves moving backwards to an earlier stage of the model, or shifting forwards faster than they might otherwise progress.
For example, the HIV/AIDS pandemic makes a dramatic appearance in South Africa’s demographic data in the early 1990s highlighted below. The death rate climbs and the birth rate drops significantly. These rates of change do not neatly fit into one of the stages of the DTM. Has South Africa been pushed back into stage 1, with high birth and death rates? Or has it been moved forward into stage 5 with more equal birth and death rates instead?
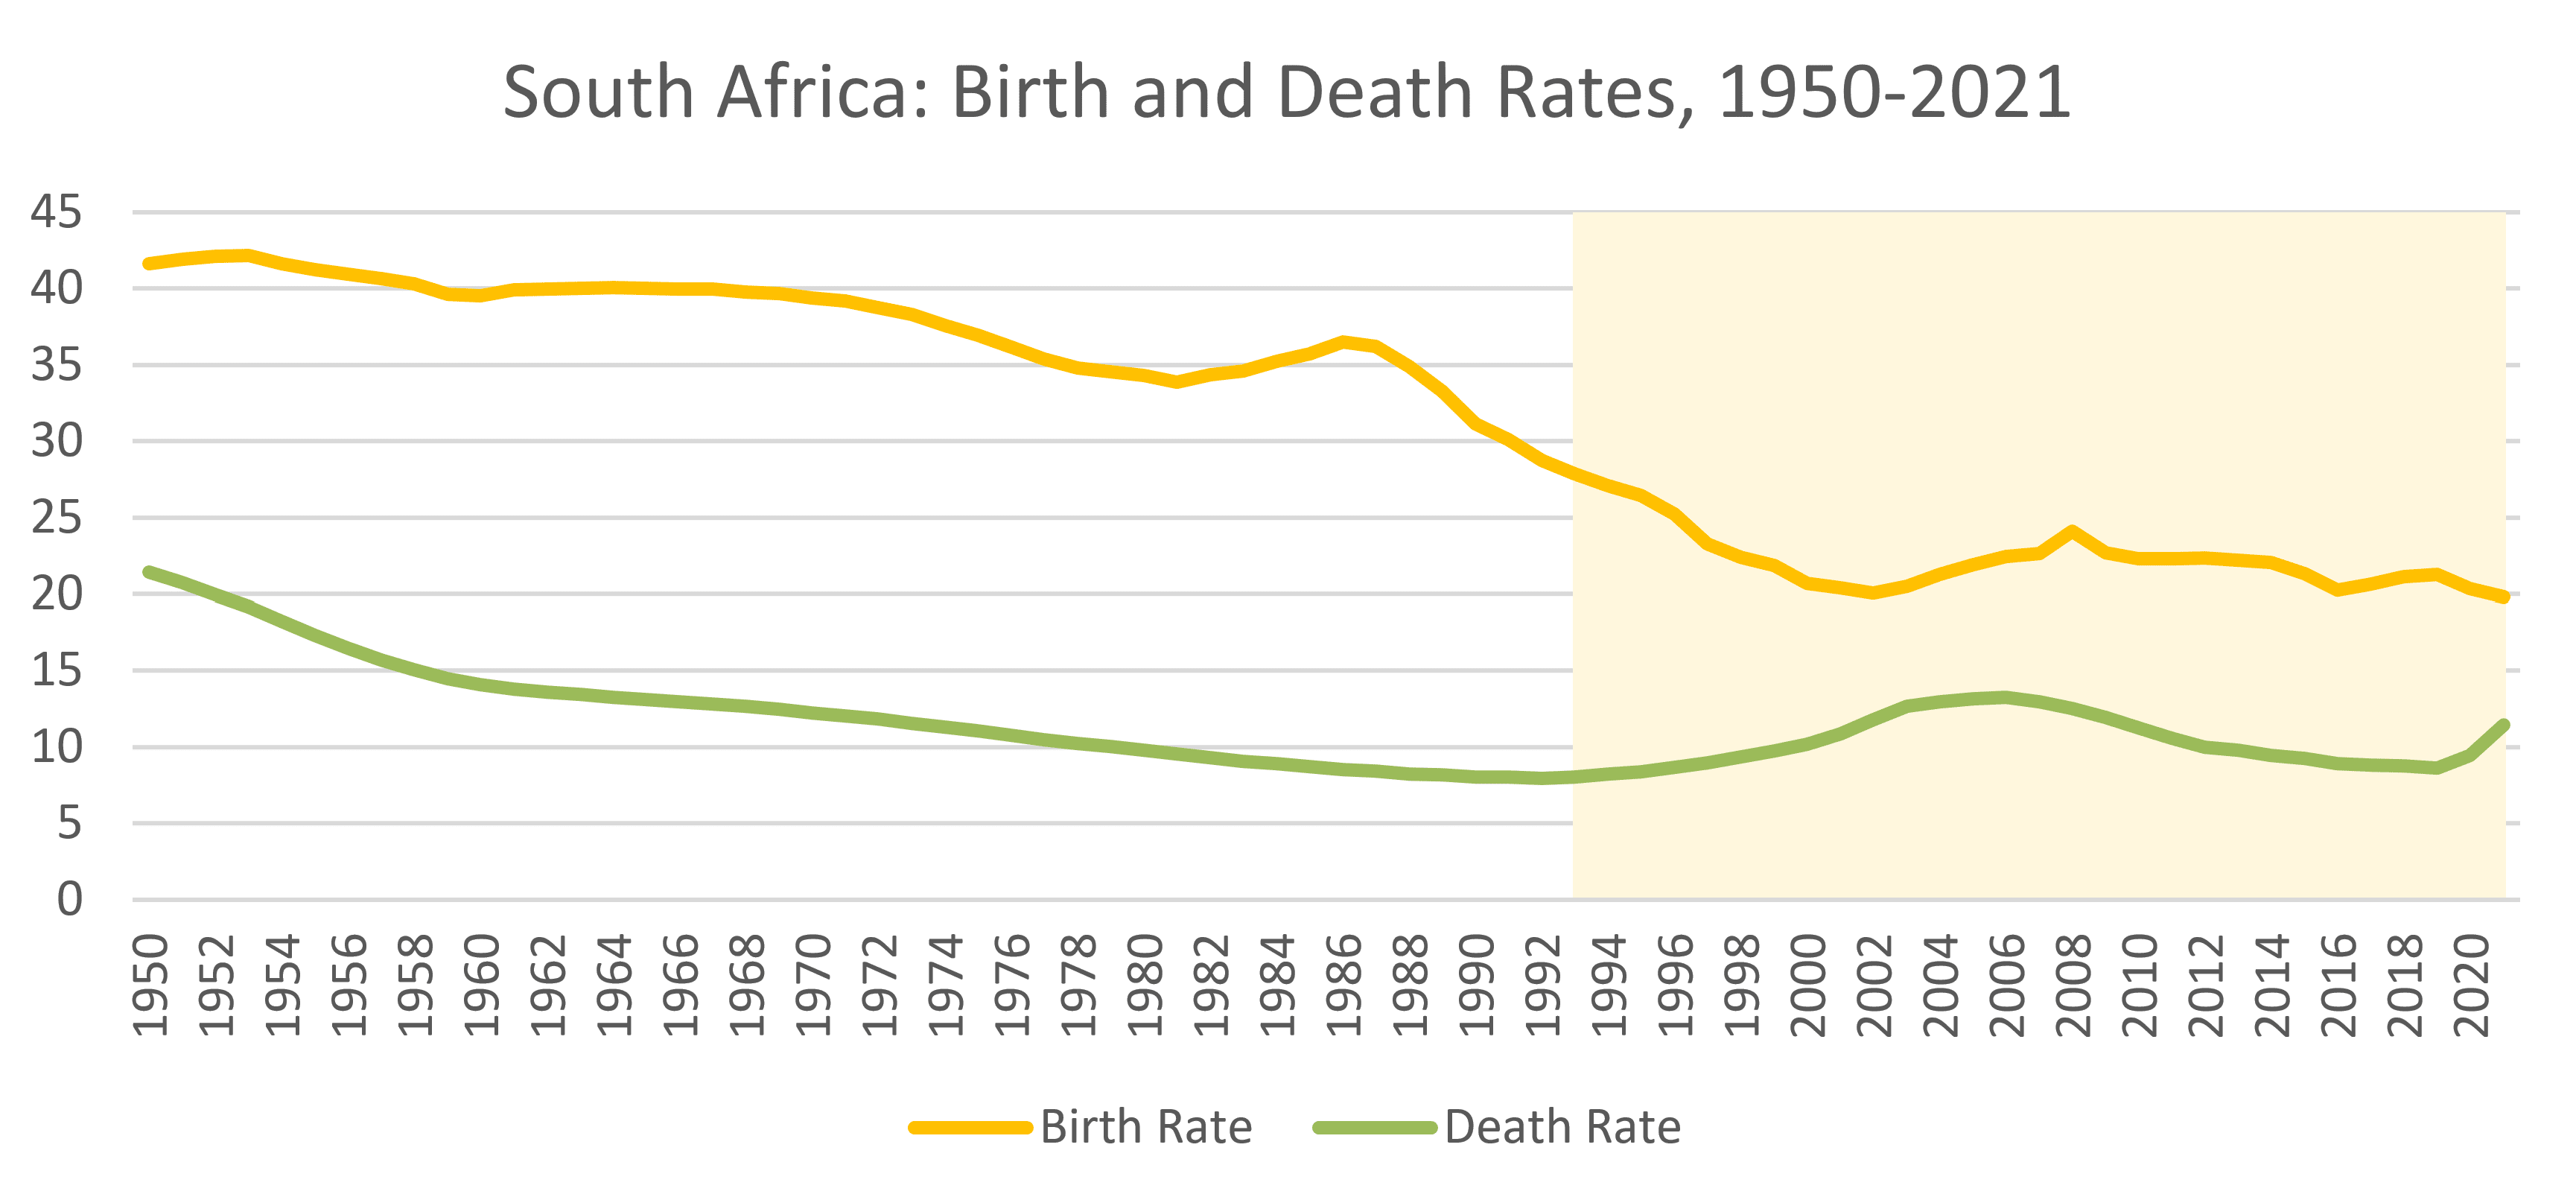
It’s still early to definitively map the impacts of the COVID-19 pandemic on demographic data across the world. Looking again to South Africa as an example, we already see a spike in death rates and a drop in fertility rates from 2019-2021. Many countries show a COVID hump in their death rates due to both the COVID-19 virus as well as interruptions to health care systems. How that impacts their economic and social development, as well as long-term impacts on birth, death, and population growth rates, still remain to be seen.
Climate change may also have significant impacts on a country’s progress through the DTM. We can guess that the number of migrants will increase as the impacts of climate change increase in intensity. Exactly how this crisis will impact a country’s transition through the DTM is up for debate. Some countries may see an increase in death rates due to climate disasters like drought, sea level rise, and intense storms. Other countries may see a surge in population from migration into their borders. It’s uncertain the impacts climate change may have on fertility rates. We also do not know the full impact it will have on industrialization processes for individual countries.
Variable Fertility Trends Don’t Always Fit the DTM
In stage 3 of the DTM, we expect to see fertility rates decline. This can be due to a number of reasons. In Western Europe and the U.S., fertility declined as people moved from agricultural areas to urban areas and families needed fewer members to support agricultural production. At the same time, wages increased, access to contraception and family planning increased, and the status of women improved. This shift occurred over several generations.
Countries today see changing birth rates for a number of reasons, some of which weren’t key factors in Europe or the U.S., and at vastly different rates than the countries on which the DTM is based. The global spread of information and goods and services impacts birth rates, as do cultural beliefs, political policies, environmental changes, international conflict, and so much more. There are a number of examples of birth rate trends that do not follow a strictly-DTM-described transition.
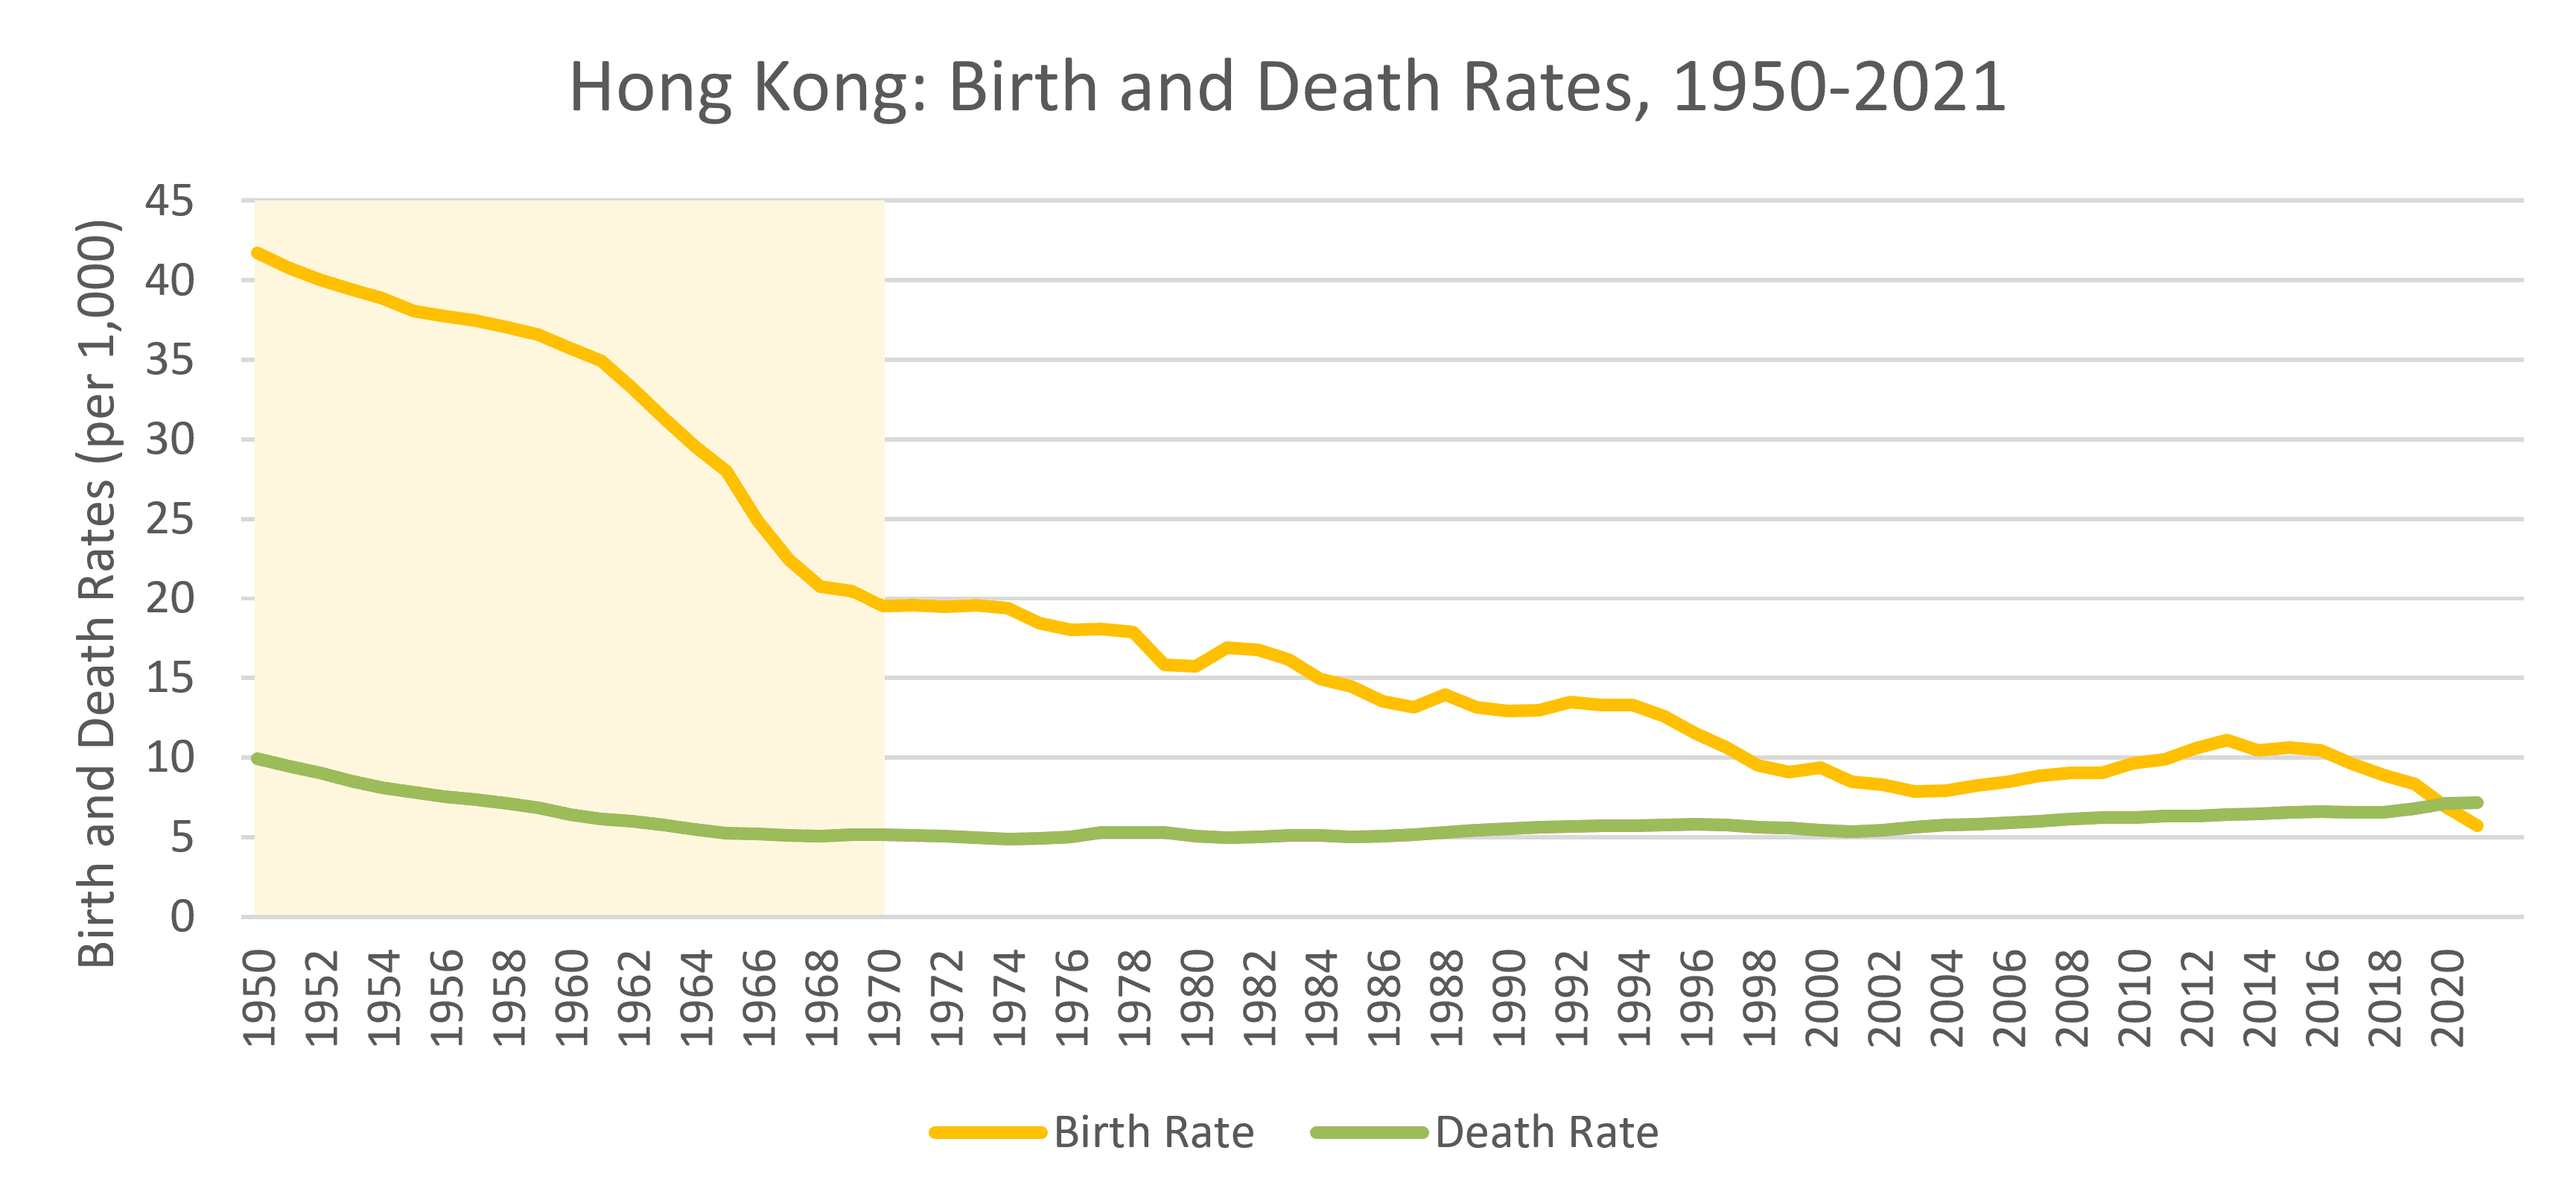
In Hong Kong, birth rates halved in just 20 years from 42 births per 1,000 people in 1950 to 20 births per 1,000 (highlighted below), and continued to fall to just 6 births per 1,000 today. The quick change is, in part, a reflection of Hong Kong’s rapid rate of industrialization and globalization, as well as strong governmental support for family planning. It’s also unlike the rate of change described in the DTM.
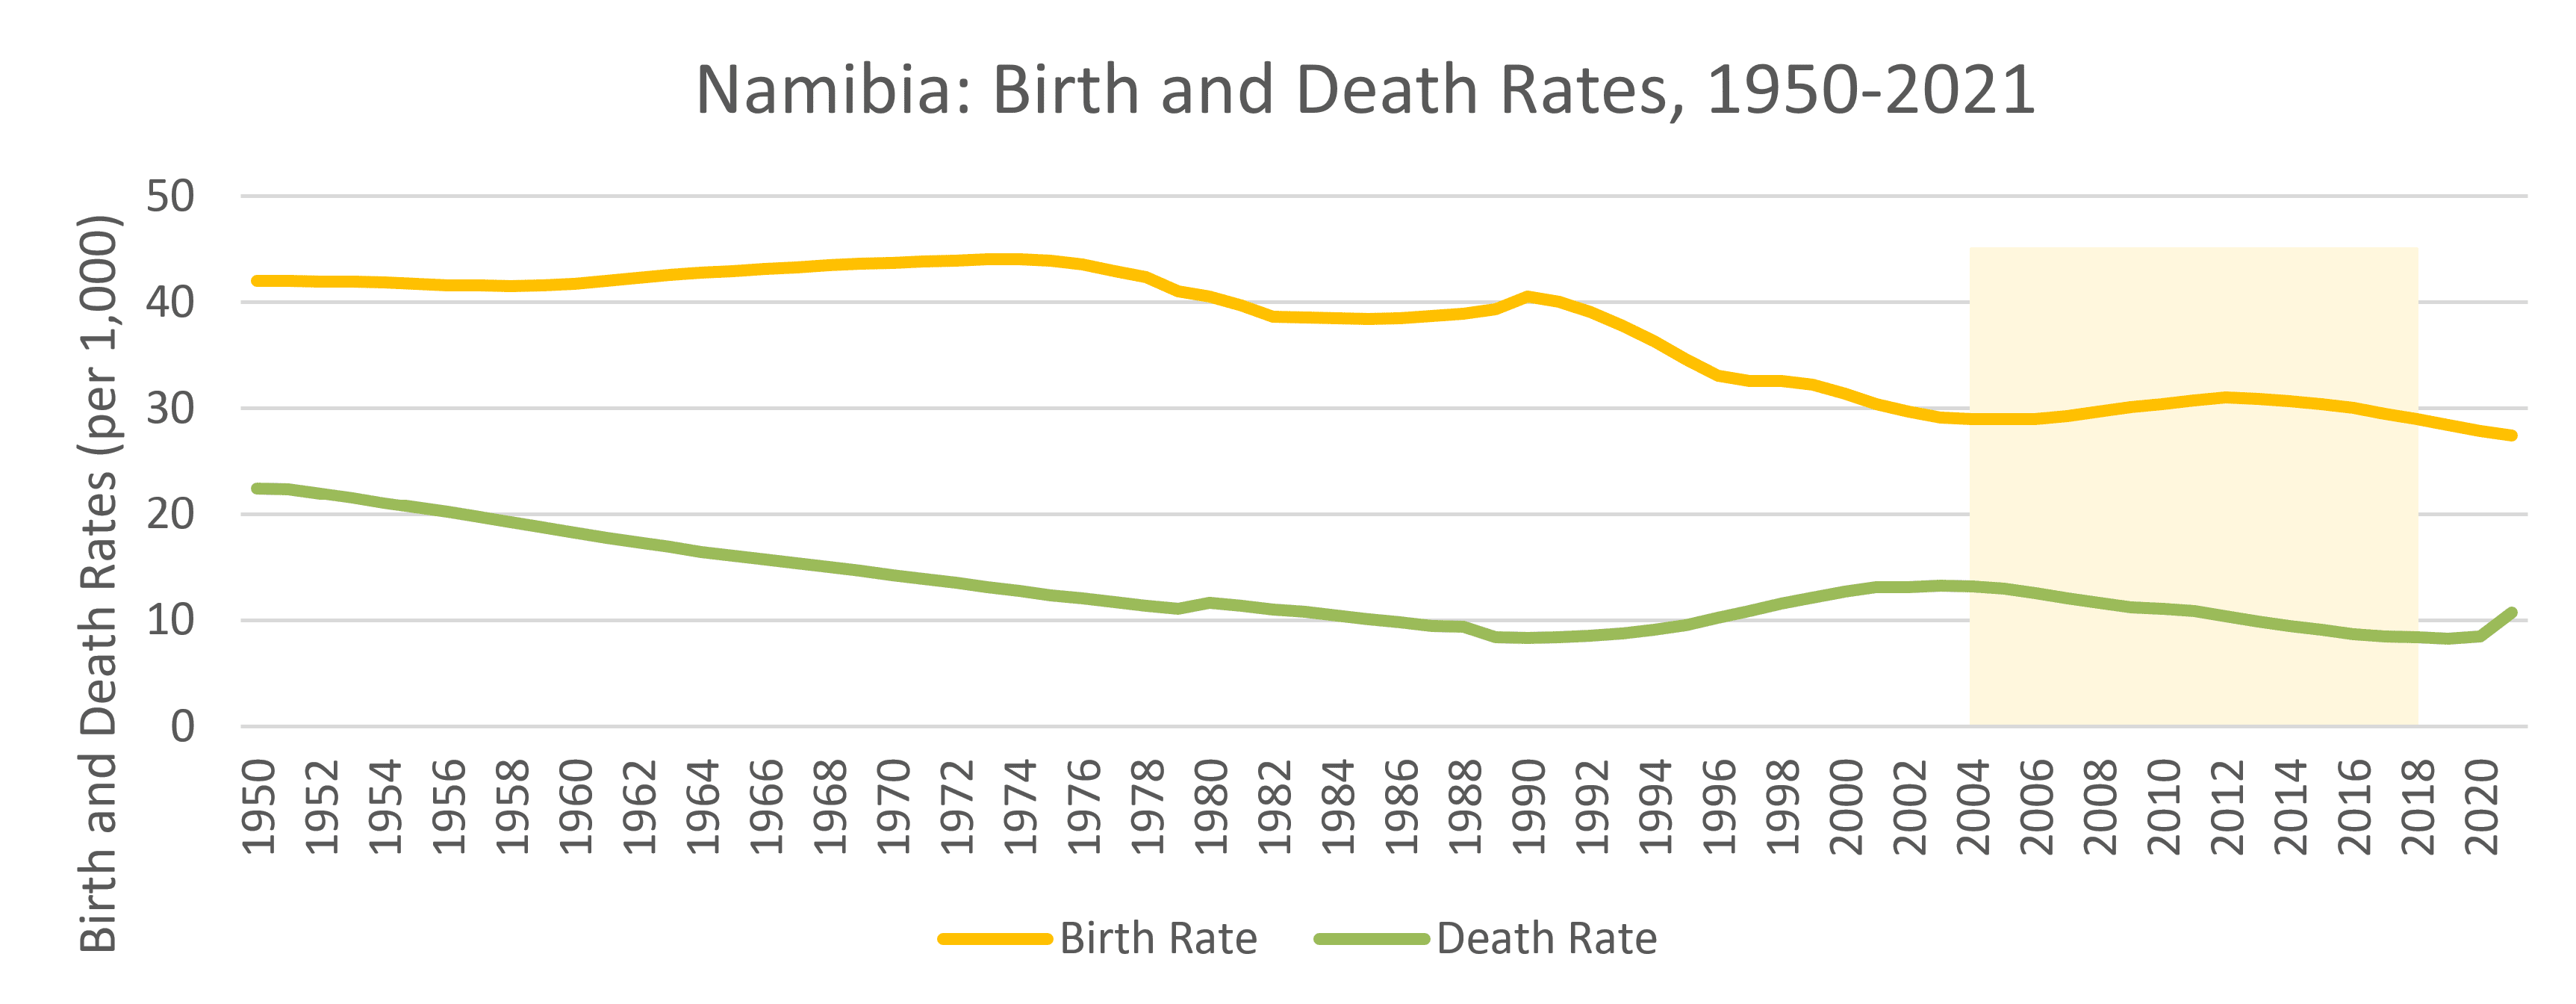
In some places, birth rates stall. In Namibia, birth rates stalled in the 2000s (highlighted below), possibly due to stalling rates of contraception use.
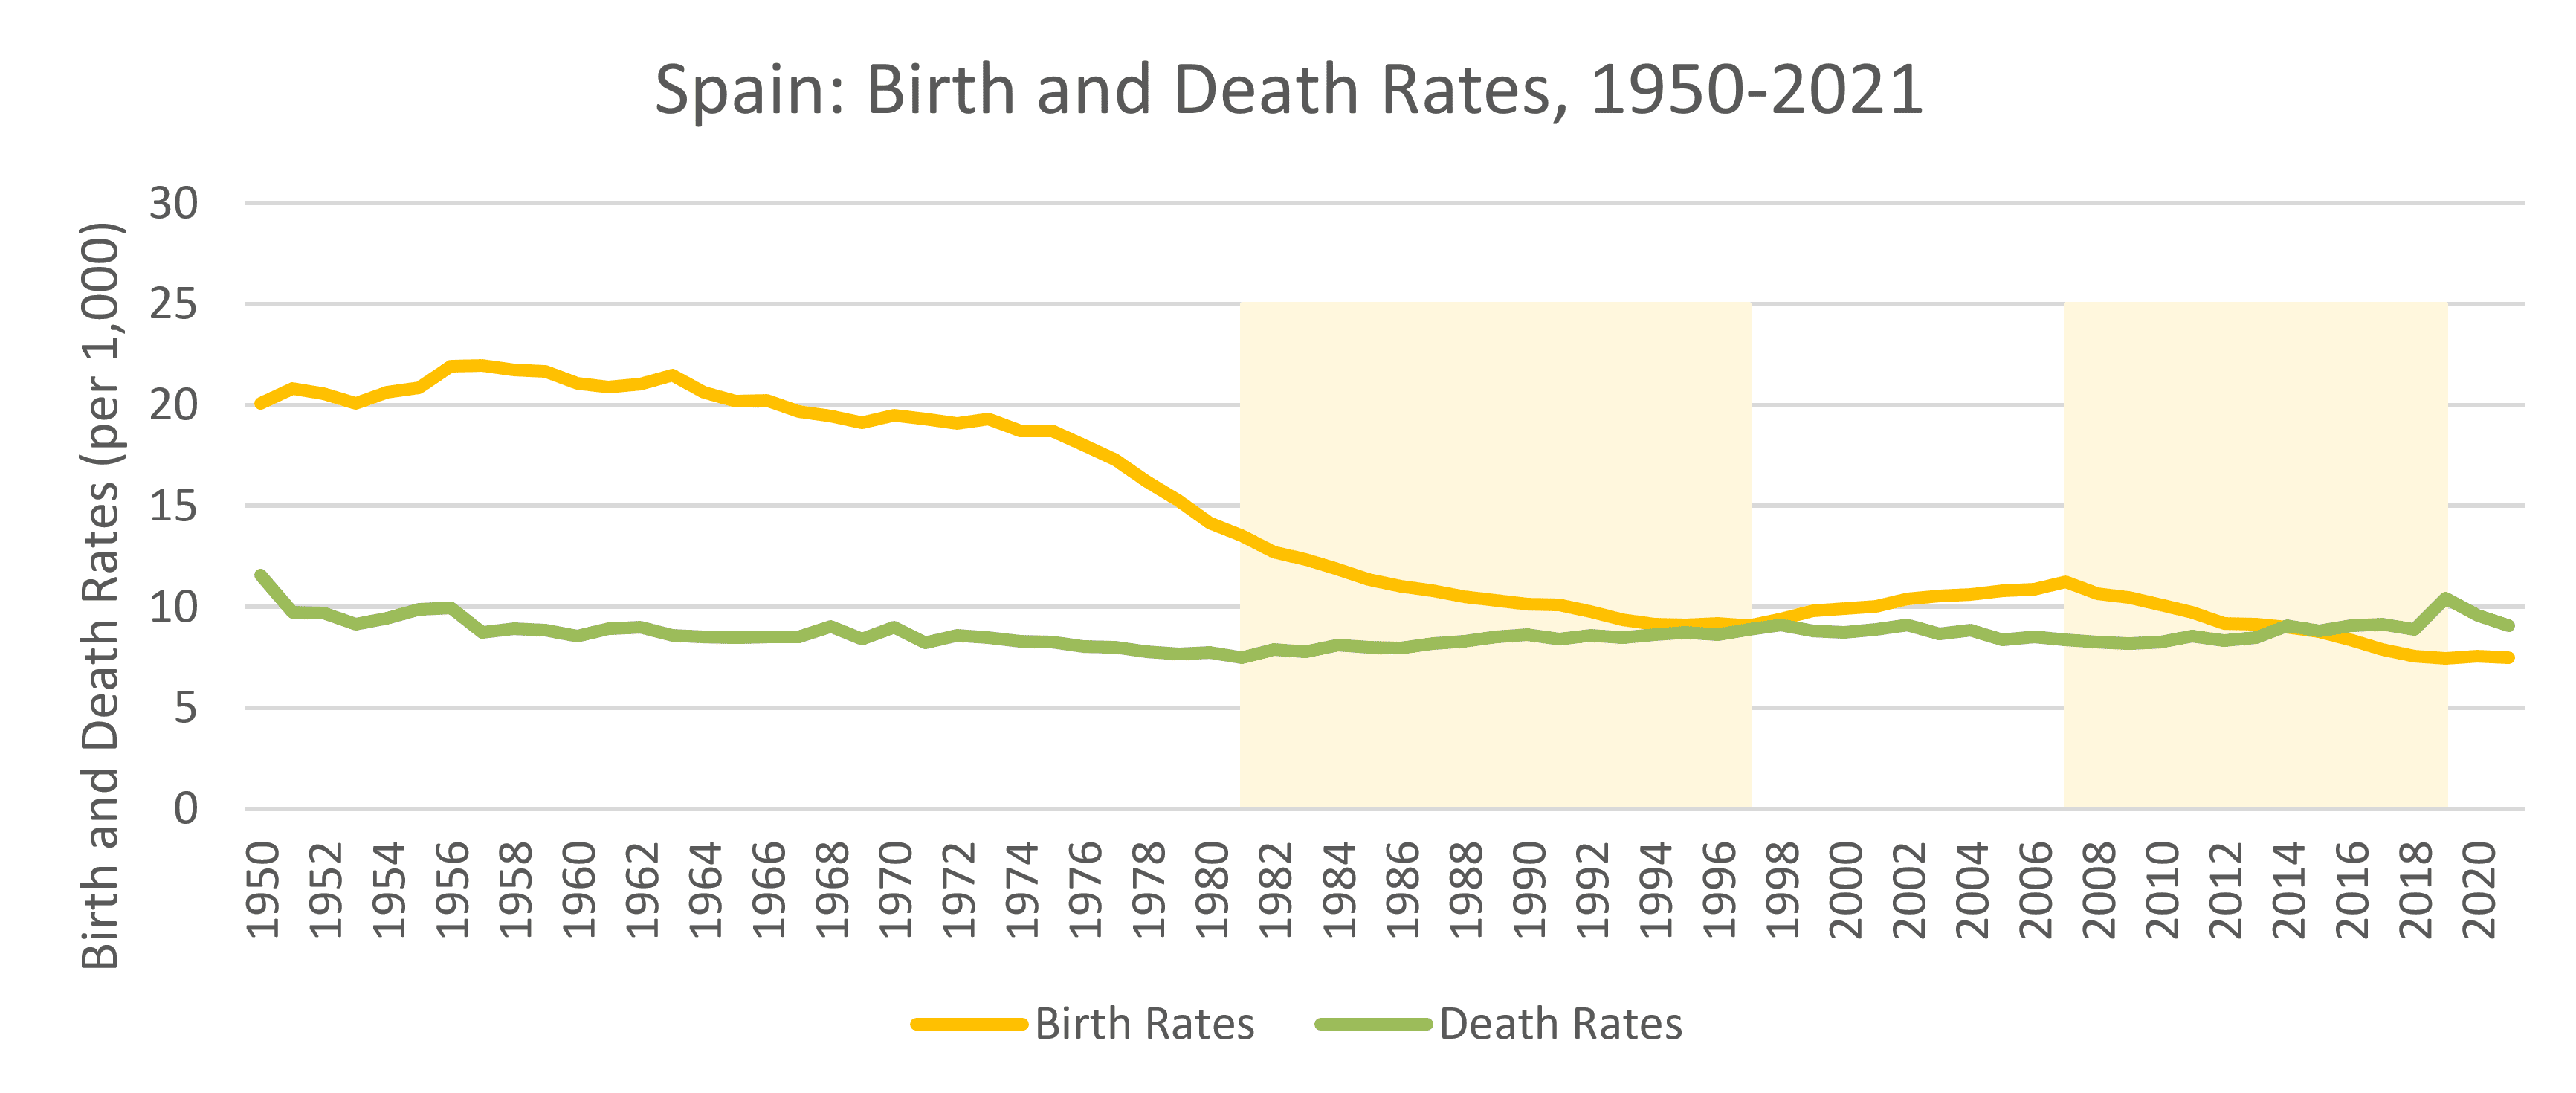
In Spain below, we see the very non-DTM trend of declining birth rates alongside increasing death rates.
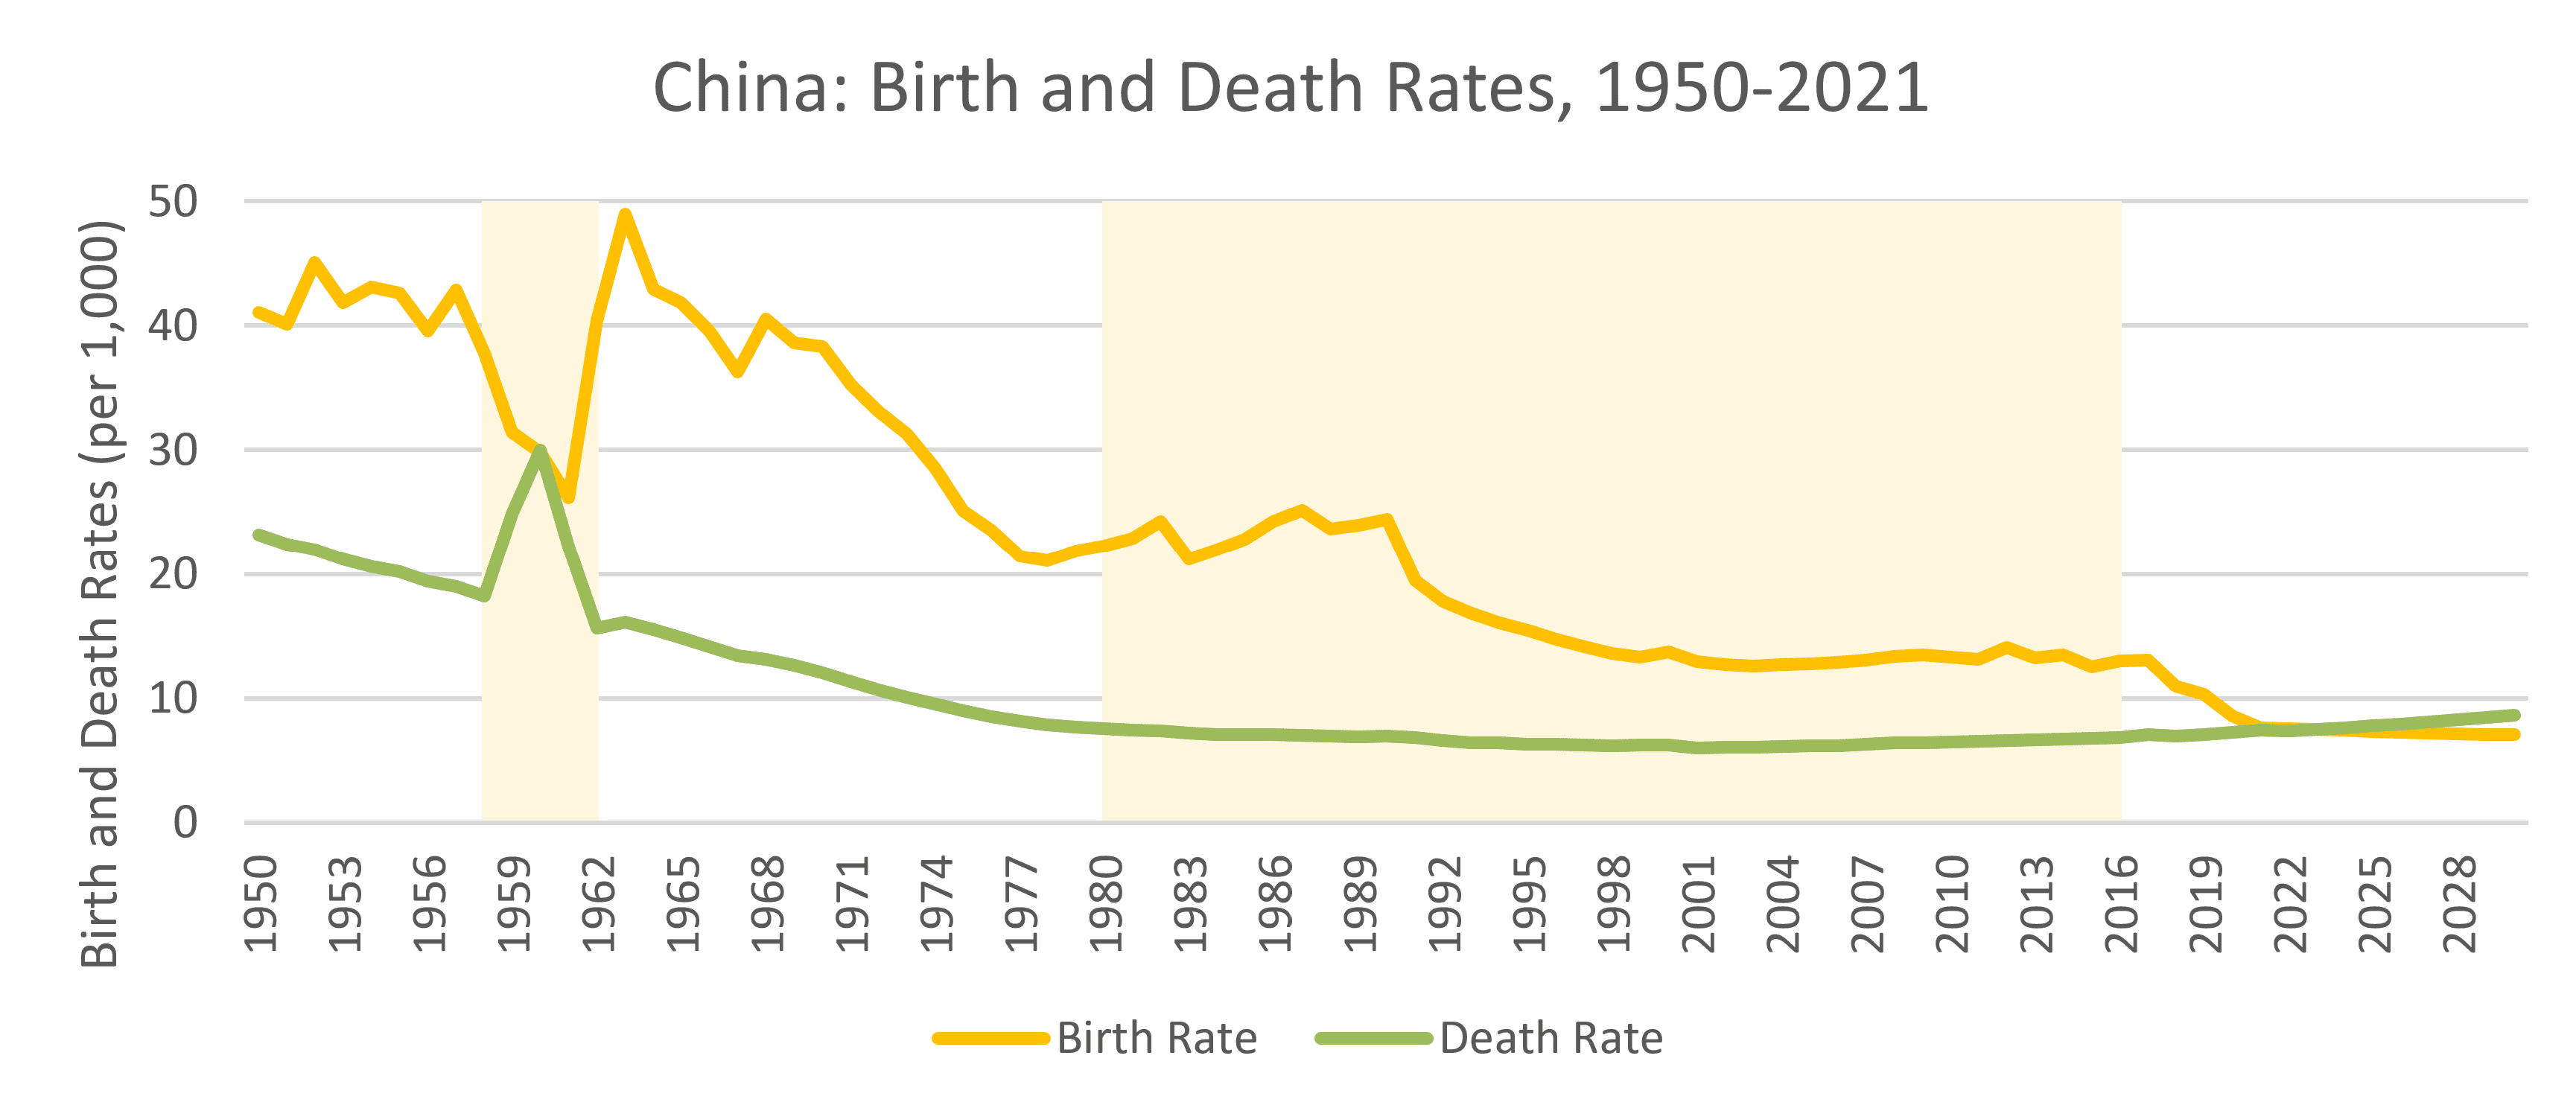
In China, we see the impact of political policies on birth rates. The effort to industrialize the economy during the Great Leap Forward (1958-1962, highlighted below) triggers a devastating famine, a declining birth rate, and a spike in the death rate. China’s One Child Policy (1980-2016, highlighted below) further decreases the birth rate. The demographic transition model assumes changing rates as a result of natural industrialization processes, and does not consider rapid changes as a result of policies.
The global flow of information, culture, money, and international aid all contribute to trends unlike Western Europe and the U.S.’s progression through the DTM. These factors are extremely complex, very interrelated, and can be tricky to tease apart. As a tool to understand fertility trends, the DTM can often be too simplistic and rigid to account for modern industrialization and globalization processes.
The DTM as a Model
While the demographic transition model still is a useful tool to predict trends, like all models, it has its limitations. Many limitations stem from the fact that the DTM is based on data from Western Europe and the U.S. leading up to the 1920s. In our modern world, with globalization, climate change, and a diverse range of cultural, political, and social influences flowing across country borders, the DTM can be less accurate to describe and predict actual demographic trends in various places around the world.