We are just a few weeks away from Geography Awareness Week (November 15-21). Sponsored by the National Geographic Society, GAW was started by a presidential proclamation more than 25 years ago with the aim of increasing geographic literacy among young people. This year’s GAW is “Explore! The Power of Maps.” Here are some ways to use Pop Ed’s newest teaching tools to raise students’ skills in using maps in the classroom.
Launched in July, this new interactive website invites visitors to “Explore the Map and Timeline.” Melding geography with world history, the site has users move through a historical, 2000-year timeline to watch the changing population on the map (with dots representing one million people). Nearly 1,500 population dots are annotated with information about the places’ history, culture and demographics. The timeline contains over 240 markers (inventions, events, discoveries, movements) that contribute to population changes.
But that’s not all. Choose from a menu of thematic map overlays to add to the population map. Watch changing land use, carbon emissions, fertility rates and life expectancy rates as the years advance.
New this week on the site are six lesson plans that encourage students to explore the map and timeline and find out more about world population – past, present and projections.
World Population Map – A Cartogram Poster
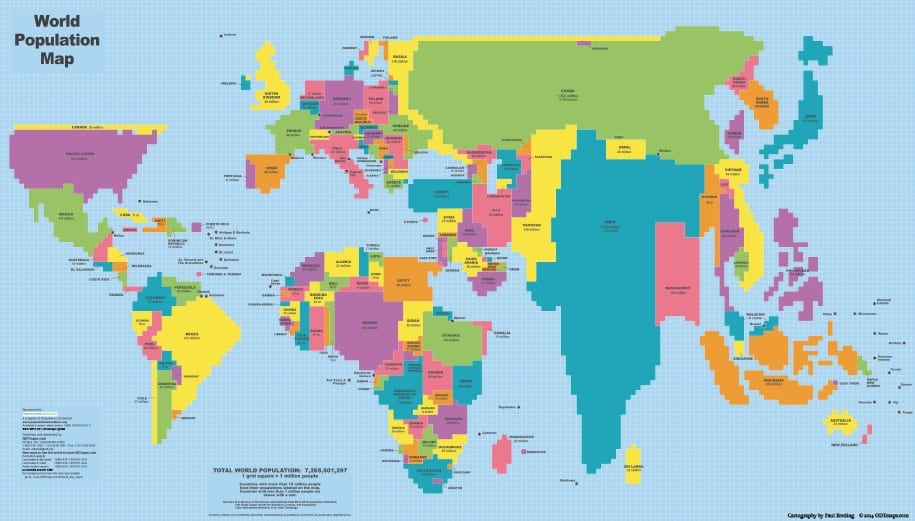
Want something low-tech but effective? Display our World Population Map, a cartogram of nearly 7,300 grid blocks, where each country is sized based on population. This poster is accompanied by a 43-page activity guide that gets your students to create cartograms of their own, explore population pyramids and lots more.
Happy Mapping!