Filter Products by Grade Level
World Population History Website
$0.00
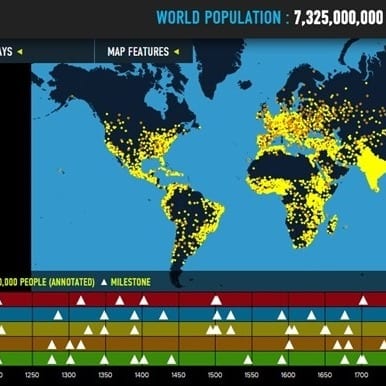
The cornerstone of World Population History is an interactive map of the world, where dots represent human population (one dot = one million people). At any time between 1 CE and 2050, you can zoom in on the map and click on individual dots to learn more about the population of that area. Turn on any number of map overlays to see how fertility rates, carbon emissions, land cover, and life expectancy have changed around the world as population increased. A historic timeline accompanies the map, offering context to the population numbers indicated on the map. Milestones relating to food, technology, people and society, health, and the environment inform about events, inventions, and social movements that have impacted human numbers over time.
Four contextual readings and six classroom lessons plans are available to help teachers utilize the site in the classroom. These detailed, teacher-friendly lessons incorporate a variety of the site’s features as well as hands-on simulations that are sure to be meaningful and memorable.
Visit World Population History now!
PREVIEW LESSON PLANS
Sample a few of the lessons found on the website:
Carbon Crunch (pdf): Students use a timeline to explore energy-related environmental issues through history then compare countries based on their CO2 emissions and their climate vulnerabilities.
Where Do We Grow From Here (pdf): Students explore and discuss the UN’s population projections and model population growth projections from 1800 to 2100 to see where in the world population growth has and will occur.


