 Apportionment is one of the most important processes in U.S. politics, but don’t worry if you’re a bit hazy on a term that only emerges in the press once a decade. Apportionment is the process of dividing the 435 seats in the U.S. House of Representatives among the 50 states.
Following the decennial census, congressional seats get reassigned depending on population gains and losses in states since the last census. Because the size of the U.S. House of Representatives is capped at 435, any population growth and shifts between decades lead to a reallocation of those seats. Every time this is done there are “winners” and “losers” and a redrawing of congressional district maps. In recent decades, U.S. population has been shifting south and west, garnering more House seats for states like Texas and Florida, and fewer for states in the Northeast and upper Midwest.
The History of Apportionment
The founders had originally intended for the size of the “People’s House” to grow as the population did. In the Federalist Papers (1788), James Madison suggested that the body should maintain a representation ratio of at least 1:30,000 (meaning one Representative for every 30,000 people), but didn’t indicate how large the legislature should get. Back then, the U.S. population was 3.9 million people and the first legislative session included 65 Representatives (1:60,000 representation ratio). As the country’s population grew and more states were admitted into the union, the size of the U.S. House of Representatives, and the number of congressional districts, grew as well, following each decennial census. (As a side note, if the House of Representatives were to maintain the 1:60,000 ratio, there would now be 5,500 members of Congress, instead of the more manageable 435.)
Over the centuries, there have been five different mathematical methods used to reapportion the Congressional seats, all with the aim of keeping each congressional district a similar population size. In 1941, Congress adopted the current formula, the Huntington-Hill Method, or “Method of Equal Proportions” for reapportioning House seats. This short video from the Census Bureau provides an overview.

In 1911, President Taft signed legislation that would increase the size of the chamber from 391 to 433 and then to 435 when Arizona and New Mexico became states. Some members feared the legislature was becoming too large and unwieldy, but also at issue was the urban-rural divide. The U.S. population growth between 1910 and 1920 would’ve increased the House numbers to 483, with most of the new seats awarded to more urban states in the Northeast, the home of growing industries and burgeoning immigrant populations. Politicians from rural states feared an erosion of their power. Congress failed to reach a consensus, preventing reapportionment after the 1920 census. Finally, in 1929, Congress passed the Permanent Apportionment Act, capping the size of the House at 435 members.
Reapportionment from the 2020 Census
Today, the average congressional district includes 761,000 residents, but the representation ratio can vary widely because the population sizes of states are so different (from 577,700 in Wyoming to 39.2 million in California). Consider two states with smaller populations. Montana with 1,085,407 people just earned its second district, so each will now contain 542,703 people. Delaware is slightly smaller (990,837) and will continue to have one congressional district – the largest (by population) in the country.
With the House size static, even states that gain in population from one census to the next can still lose seats. This can happen when the state’s population growth rate is lower than the national average. That’s the case this year for California, which grew by 2.3 million people in the past decade – a 6.1 percent gain – but fell short of the national gain of 7.4 percent. In fact, all but three states (West Virginia, Mississippi and Illinois) gained population from 2010 to 2020, but several didn’t gain a large enough proportion to avoid losing representatives. New York lost one of its seats by the narrowest of margins – just 89 residents short of maintaining its 27th district.
What’s at Stake in Redistricting and Apportionment?
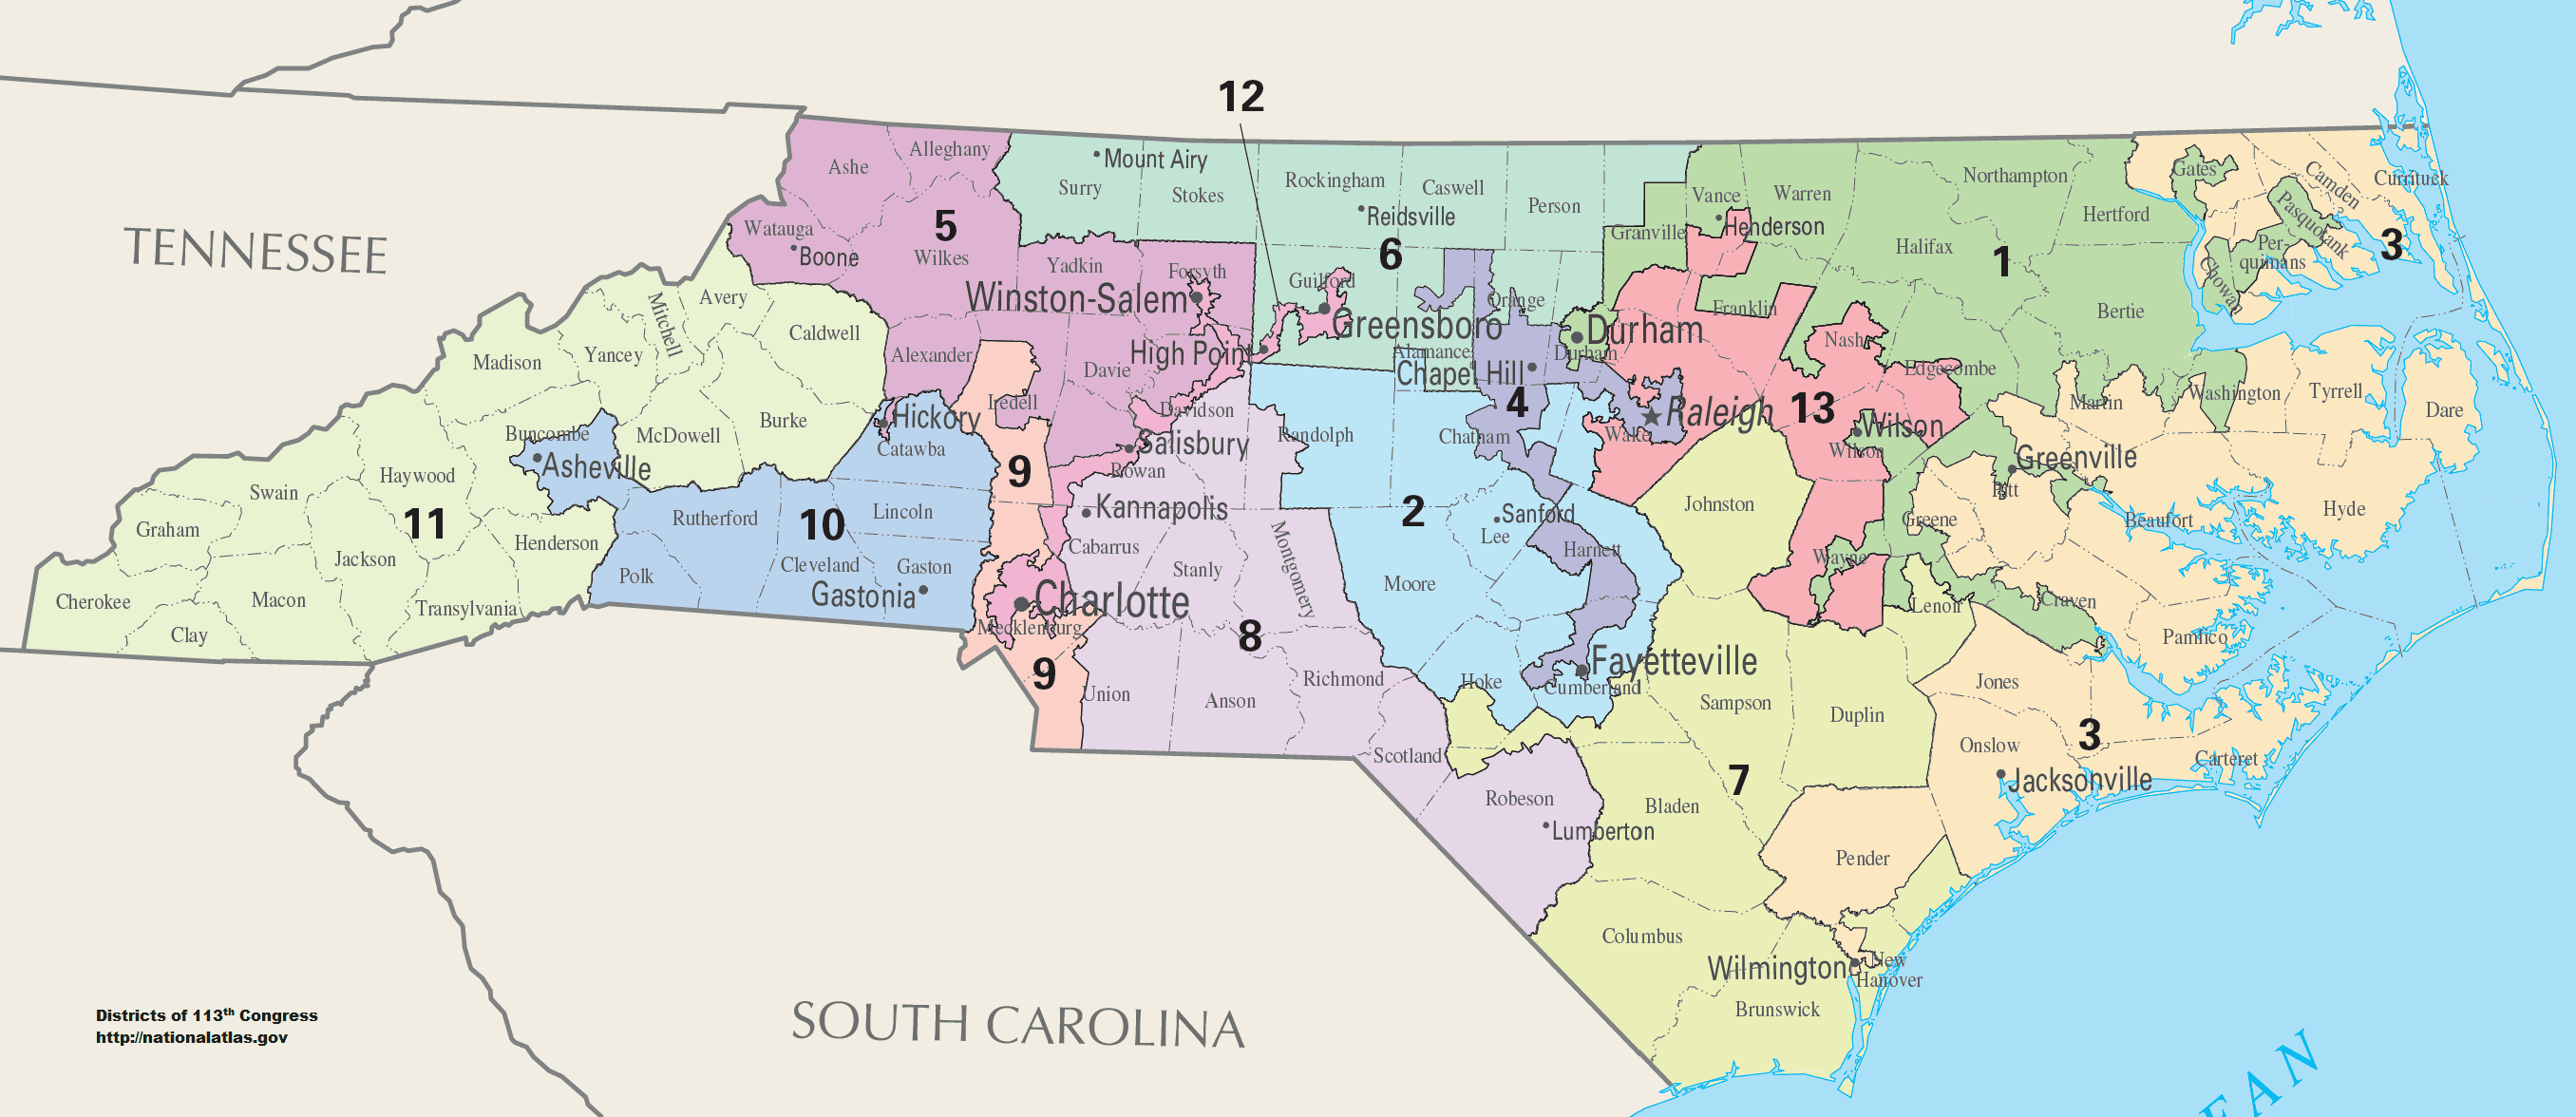
Reapportionment sets into motion a cascade of changes that have significant implications for democratic representation. State congressional maps are redrawn and the party controlling each state’s legislature gets to decide how that’s done. This often results in a gerrymandered map that benefits the controlling party for the next ten years. The results of the 2020 Census will determine House districts starting next year with the 2022 midterm elections. The number of a state’s seats also determines the number of that state’s electors for presidential elections. Each state receives one electoral vote for every representative it has, plus one for each of its two senators.
 Since the House sized was capped at 435 members in 1929, the U.S. population has tripled. Many feel that as the ratio of representatives to constituents keeps growing, that relationship gets diluted, and along with it, true representative democracy. Voices of individual voters get fainter. And with such disparities in state population (and thus, congressional district size and composition), the value of each person’s vote varies depending on where they live. Because we’ve adopted a system of “zero-sum apportionment,” it means that in order for residents of any state to gain representation, residents of other states have to lose. Statehood for the District of Columbia and/or Puerto Rico would require some states to lose representatives.
Some political scientists think it’s time to rethink that 435 cap and look to expand the size of House to both bring down the representative ratio and make gerrymandering more difficult. As long as there is a partisan divide, there will be debates on the ideal size of our representative body and how best to apportion those seats.
Image credits: US Capitol building (ID 30504429 ©Pandara, Dreamstime.com)


