Total fertility rate (TFR) is defined as the average number of children a woman will have in her lifetime in a given population. Take a look at the chart below to see trends in TFR from 1990 to 2020, according to the 2021 World Population Data Sheet. The chart includes TFR in 1990 and TFR in 2020 for major world regions, countries of interest, for countries by income group, as well as the global average total fertility rate.
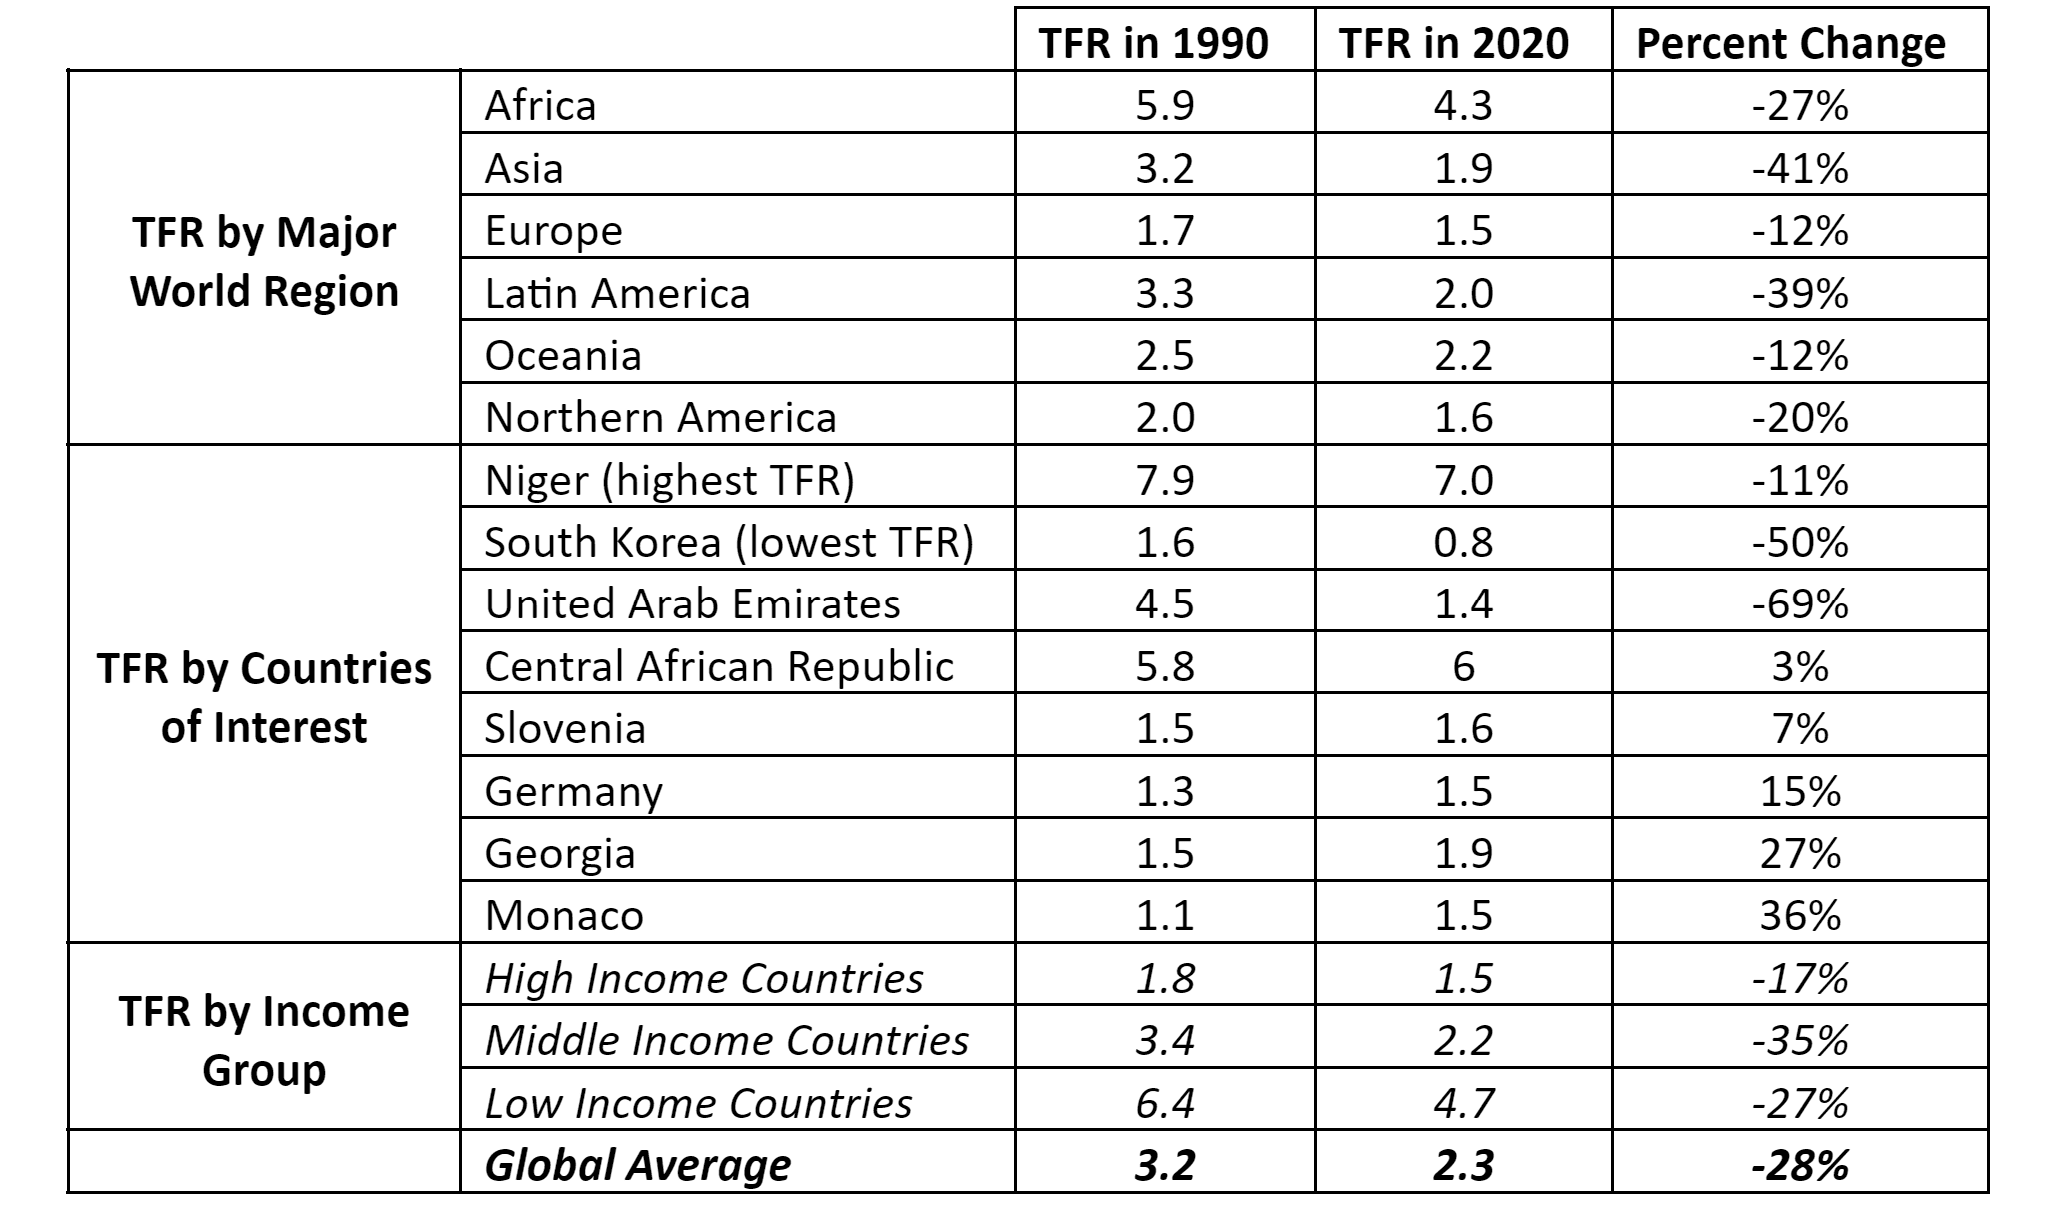
The country with the lowest TFR as of 2020 is South Korea (0.8), while the country with the highest TFR is Niger (7.0). The United Arab Emirates has experienced the greatest change since 1990, with a 69% decline in fertility rate. Of the 202 countries included in the World Population Data Sheet with data from 1990, 93 have a TFR that is at or below replacement level fertility. Only five countries have increased their TFR since 1990 and only seven countries’ TFR remained the same from 1990 to 2020. There are 28 countries that have a TFR that has decreased by 50% or more since 1990.
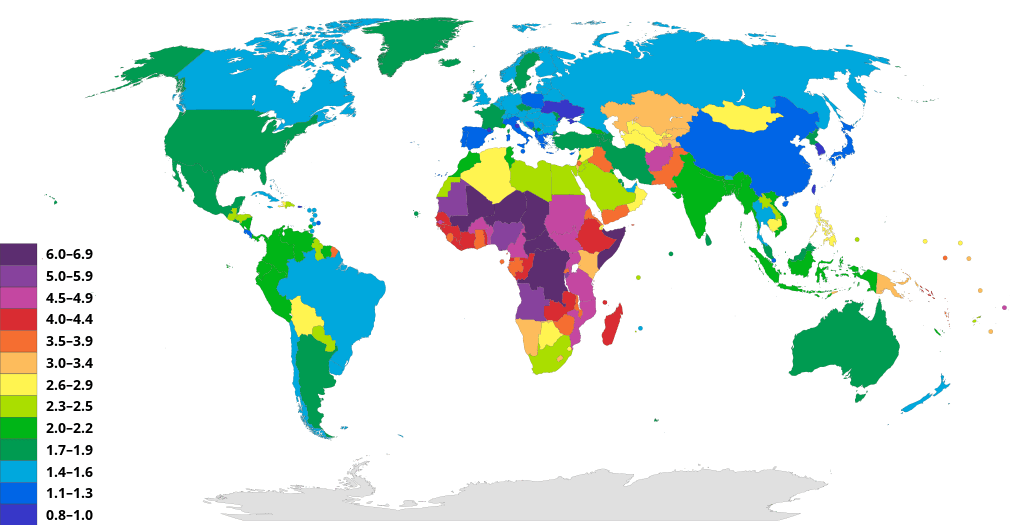
Total Fertility Rate by country
What Do TFR Trends Tell Us?
Total fertility rate is strongly correlated with several quality of life indicators. While we can glean many insights from fertility rates, it is important to keep in mind that it is a lagging, not a leading, indicator. In other words, changes in total fertility rate are a result of – not a cause of – changes in quality in life.
A decreasing fertility rate is indicative of a nation undergoing the demographic transition. With the economic and educational opportunities that accompany industrialization, couples often choose to delay having children in order to pursue professional ambitions. Women in particular enjoy improved family planning access and more varied life opportunities due to industrialization.
Global fertility rates have been on the decline for decades. In that time, the global percentage of people living in abject poverty has decreased from 36% in 1990 to 9.2% today. The literacy rate of women has increased from 67% to 83% in that time as well. Despite increasing income inequality, the lowest income earners are experiencing improved quality of life. When considering only the least developed countries, this trend holds true. Although the typical fertility rate in a less developed country is much higher than the global average, this fertility rate is still decreasing and quality of life is improving. In the most developed countries, fertility rates are dropping as they move into the post-industrial stage of demographic transition.
Benefits and Challenges of a High TFR
Both ends of the fertility spectrum pose unique benefits and challenges. In the least developed countries, a high TFR and rapidly growing population can be difficult to accommodate on already strained resources like infrastructure, sanitation, jobs, clean water, and food supply. However, a growing population means that the elderly can receive adequate support from younger generations. An increasing population can also make it easier to increase GDP. For example, Nigeria has a TFR of 5.3. In 1990, their population size was approximately 95 million people. As of 2020, their population was greater than 208 million people. In that same time span, their urban population has increased from 30% to 52%. Much of Nigeria’s population growth has occurred in the megacity of Lagos. While this has been great for Nigeria’s GDP, inadequate planning has led to slums and a lack of sanitation infrastructure.

Benefits and Challenges of a Low TFR
In the most developed countries, lower TFRs and shrinking populations threaten safety nets for the elderly, such as social security funds. Furthermore, a declining workforce diminishes a nation’s opportunity for innovation and economic growth. In countries like Japan, GDP growth has stagnated for decades – largely due to their aging population and a declining population. However, in higher-income countries that have higher greenhouse gas emissions, slowing population growth eases constraints on our shrinking carbon budget and is indicative of higher gender equality.
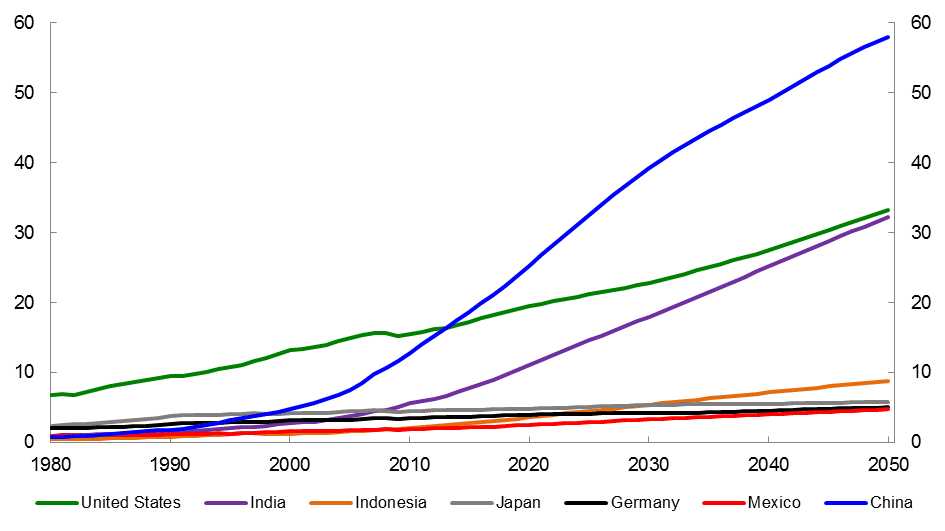
Projected GDP of various countries, including Japan, in trillions of USD
It is critical that societies across the globe prioritize the need to provide everyone with adequate access to family planning resources so that each person can achieve their individual fertility goals. When women are able to achieve reproductive and educational equality, that’s good for both people and the planet.
Total Fertility Rate in the Classroom
Some of the most popular PopEd lessons and resources can help your students grapple with total fertility rates and their implications on development and quality of life indicators. Check out the activities Demographically Divided World, Food for Thought, and All in the Family, as well as our sister website, WorldPopulationHistory.org, to learn more!
Image credits: TFR map (Total Fertility Rate Map by Country by Korakys is licensed under CC BY-SA 4.0); Lagos (Victoria Island, Lagos, Nigeria by OpenUpEd is licensed under CC BY 2.0); GDP graph (Project GDP of China, United States, India, Indonesia, Japan, Germany and Mexico to 2050 in trillion $US (2012 PPP) by Asiancentury is licensed under CC BY-SA 4.0)