When we scroll through social media or read the news, we aren’t just looking at text. We are constantly faced with charts, statistics, and graphics trying to tell a story or influence our opinions. In today’s world, understanding these visuals is just as important as understanding the words that come with them. And this, in a nutshell, is why data literacy matters.
In and beyond the classroom, students encounter charts, graphs, maps, and statistics every day. Data literacy is important for academic learning but also has real-world relevance. We rely on data literacy when we explore a new place, decide how much to budget from an allowance, monitor our physical activity, or read election polling. To fully understand, interpret, and successfully navigate these experiences, students need data literacy.

What Is Data Literacy?
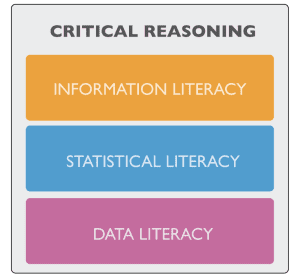
Data literacy is the ability to read, write, analyze, communicate, and reason with data. It is what allows individuals and organizations to make better decisions based on facts. It’s not just about working with numbers: data literacy involves the interpretation of various visuals, including bar charts, scatter plots, infographics, and maps.
For example, a student should be able to analyze a graph showing rising sea levels, question the source of a bar chart in a post on social media, or use a dataset to compare high school graduation rates across states. This goes beyond identifying trends. It might involve asking whether a graph omits key data points, whether scales are distorted, or whether correlation is mistaken for causation.
These data literacy skills require curiosity, critical thinking, and a bit of skepticism about where data comes from and what it’s trying to say. Students must be able to ask questions like: Who created this visual or dataset? What is it portraying? Has anything been left out? Data literacy allows them to move past surface-level interpretations and critically engage with information presented to them.
Just like we teach students to read and write over time, we also must teach them to interpret and communicate with data. Data literacy is not an isolated skill, but is inherently cross-disciplinary and an essential part of learning across various subjects.
Why Is Data Literacy So Important?
 Whether they realize it or not, students are constantly exposed to information influenced or molded by data. For example, an advertisement might highlight a ‘scientifically proven’ success rate, relying on data that has been selected and framed for marketing purposes. Beyond advertisements, data plays a role in countless daily decisions. When people compare prices at a store or online, they are analyzing cost and value. When choosing which route to take based on traffic or landscape, they are interpreting data visualizations like maps. Even on social media, people are constantly seeing polls, infographics, and statistics on all sorts of topics. Developing data literacy gives students more control over how to interpret the world and make personal decisions.
Aside from their day-to-day lives, the benefits of data literacy help students make sense of the world around them. Most current events and large issues in the world, including climate change and global health, are deeply tied to data. Scientists use climate data like global temperature records, CO2 levels, and ice melt rates to model future environmental changes. Public health officials rely on infection rates, vaccine efficacy data, and demographic statistics to track disease outbreaks and inform health policies. Data reveals patterns, disparities, and provides a clear picture of what is going on. When students can explore real datasets and understand them, they can see the relevance of data in understanding the world.
With the sheer amount of data and information in the world, there is much room for misinformation and disinformation. Navigating a data-heavy world highlights the importance of data literacy for students. When faced with a misleading graph or out-of-context statistic, a data-literate student knows how to evaluate the information presented and can make informed decisions.
Data Literacy Requires Practice
Like any other form of literacy, data literacy is built over time. Students need frequent chances to practice data literacy skills not just across different subjects, but throughout their entire K-12 educational journey. Even in early elementary, students can practice foundational data skills like tracking weather patterns, analyzing student attendance data, or mapping out school locations. Consistency is a key element of data literacy education.
And guess what – teaching data literacy doesn’t only belong in math or science classes. Try to incorporate data literacy across the curriculum! In social studies, students will need to be able to understand and analyze demographic, economic, and societal datasets. Data literacy in social studies also relates to the ability to recognize and interpret spatial patterns and representations. In language arts, students must analyze visual data in informational texts, and in opinion pieces, consider why the author chose to include it. The ELA Common Core state standards include the ability to integrate and evaluate “information presented in different media or formats (e.g. visually, quantitatively) as well as in words to develop a coherent understanding of a topic or issue.” Interdisciplinary work helps students see that data isn’t just technical, but often personal and powerful.

Aside from incorporating data literacy across subjects, students are more engaged when working with real datasets. New or current information from NASA, the U.S. Census, or even collecting their own data would help students see how prevalent data is, and the importance of being able to interpret it. (Want proof? Check out the data tools at the NASA Center for Climate Simulation or the CDC’s COVID-19 data tracker.) By learning data literacy authentically, they also build confidence and capability as students and as informed citizens.
To create this data-literate classroom setting, there are many things that can be implemented. Using visuals in class, highlighting data in the news, using text questioning, encouraging collaboration, and allowing room for creativity are all steps that normalize data as a tool for exploration. The underlying key for data literacy growth is for students to use various forms of data often and in diverse settings.
The Impact of Data Literacy on Student Empowerment
Data literacy encourages students to ask smart questions, challenge assumptions, and engage deeply with the world they live in. Students need to see the stories behind the statistics because when data is understood accurately, it has the power to really create change. The time for teaching data literacy is now.
Image credit: Graphs on computer screen (Image by yatsusimnetcojp from Pixabay); Data literacy and critical reasoning (Milo Schield Literacy Framework: Data literacy, information literacy, statistical literacy (4/6)” by justgrimes is licensed under CC BY-SA 2.0); Engineer showing data on screen (Image by This_is_Engineering from Pixabay)