This is the final post (6 of 6) in a series about the Demographic Transition Model – a fundamental concept in population education, which is covered in Social Studies courses, most notably AP Human Geography.
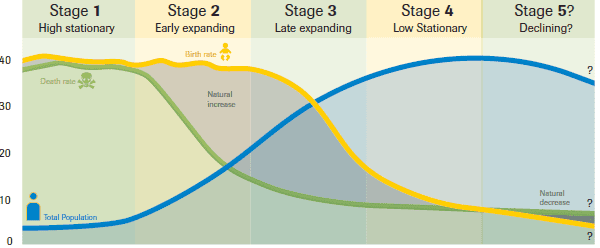
What happens when the birth rate of a country declines to the point where it is lower than the death rate? Answer: entry into Stage 5 of the Demographic Transition Model (DTM) – theoretically. In Stage 5 of the DTM a country experiences loss to the overall population as the death rate becomes higher than the birth rate. The negative population growth rate is not an immediate effect however. Based on demographic momentum, in which total population growth increases even while birth rates decline, it will take a generation or two before a negative population growth rate is observed.
In this scenario it is the economy that is the driving force behind further limits on family size and the use of contraception. Whether persuaded by the high costs of raising a family in cities or the enticing opportunities of employment that delay child bearing, birth rates decline well below replacement level (2.1 children per woman). What occurs is an aging citizenry that will eventually lead to a decrease in total population. Other explanations for declining birth rate can be linked to biological or political causes, and consequently fertility rates differ from country to country. One of the most infamous acts associated with population planning is China’s One-Child Policy. Since its implementation in 1979, China has not only witnessed a decline in birth rate but also a real demographic challenge: a gender imbalance, which is likely to lower the birth rate even further. These social and political elements are not factored into the DTM equation but both have consequential impacts on total population.
In recent years a few countries, primarily in Eastern and Southern Europe, have reached a negative rate of natural increase as their death rates are higher than their birth rates. Possible examples of Stage 5 countries are Croatia, Estonia, Germany, Greece, Japan, Portugal and Ukraine. According to the DTM each of these countries should have negative population growth but this has not necessarily been the case. Complicating the Demographic Transition Model’s framework is the impact of migration across national borders. Even with smaller birth rates countries are still growing because of positive net migration rates. This demographic phenomenon has muddled the expected progression of countries along the DTM. Does a country belong in Stage 5 if it has a higher death than birth rate but does not have negative total population growth? The debate begins here.
Demographic Transition Model Stage 5 Case Study: Germany?
Though ranked as the 16th most populous country in the world, Germany’s rate of natural increase is below replacement level. In 2013, the death rate (11/1000) was higher than the birth rate (8/1000) and this was not a new trend. In fact Germany’s death rate has outpaced its birth rate annually for the last forty years. Given these statistics the total population growth should be negative because at -.02%, the rate of natural increase is far below replacement level. Placing this data within the DTM would position Germany within Stage 5, except for one major exception, its total population is increasing. Remarkably the impact of net migration to Germany, combined with the generational lag time associated with demographic momentum, has kept total population from declining.
So then what part of the Demographic Transition Model holds true? Well, for starters much of Germany’s decline in birth rate can be attributed to its strong economy, respect for gender equality and the status of women, as well as ease of access to contraceptives. Individually each of these factors has weight in limiting family size and delaying child bearing, but simultaneously their combined impact is significant and possibly why the birth rate has been below the death rate since 1972. Germany’s muddling of the Demographic Transition Model is unique for many reasons, but one in particular to note is the often perceived bias that the DTM was built as a Euro-centric. This still may be valid but it is interesting that a European country is causing some of the greatest challenges to the rule.
Demographic Transition Model blog series: Overview, Stage 1, Stage 2, Stage 3, Stage 4, Stage 5