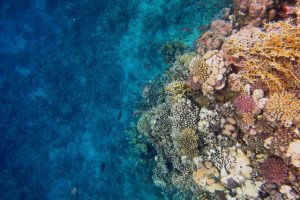
Coral reefs, although tiny on a map, are one of the most highly populated oceanic ecosystems on the planet. They cover less than 1 percent of the ocean floor but provide shelter for nearly 25 percent of all marine species.
Coral reefs are structures made by colonies of tiny coral polyps. Most people don’t realize coral polyps are animals, not plants. They’re actually relatives of jellyfish and anemones. Polyps are so tiny that if you had a cluster of hundreds in your hand, you would not see them without a microscope. These polyps slowly secrete calcium carbonate, which builds up to form hard skeletons, one layer at a time. To put this in perspective: a reef the size of a football field could take 10,000 years to form naturally.
Healthy reefs survived for tens of thousands of years, withstanding storms, temperature shifts, disease, and predators. But reefs have hit their limit. Natural threats, compounded by human impact, have strained their resilience. Now, global temperatures put them at risk of dying out.
Keep reading to learn more about what is coral reef destruction, how to prevent it, and how does it affect humans.
What is Coral Reef Destruction?
 Coral reef destruction refers to the widespread damage and decline of coral reef ecosystems caused by a combination of natural stressors and human activities. It occurs when corals lose their ability to grow, reproduce, and support marine life, often due to rising ocean temperatures, pollution, ocean acidification, destructive fishing practices, and coastal development. These pressures can lead to coral bleaching, disease, and the breakdown of reef structures that take thousands of years to form. As coral reefs are destroyed, the marine species that depend on them for food and shelter are displaced or lost, disrupting entire ocean ecosystems and threatening the livelihoods, food security, and coastal protection that reefs provide to millions of people worldwide.
Coral Reefs: Biodiversity Hotspots Under Siege
Scientists use the term ‘biodiversity hotspot’ for places like coral reefs. Biodiversity hotspots are areas packed with thousands of unique plant and animal species but many, especially marine hotspots, are rapidly being degraded by human activity, placing them at the top of the global conservation priority list.
Warm-water coral reefs are the first global ecosystem to have crossed a climate tipping point. This means that environmental changes have built up enough that reefs have reached a new state and it will be very hard or impossible to reverse the damage.
Ocean Warming and Acidification: Stressing Reefs to the Limit
Ocean warming is one of the most pressing challenges for coral reefs. Places that once flourished with blue, purple, orange, and red are now graveyards of brittle, lifeless skeletons covering the ocean floor.
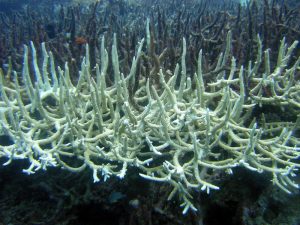
When ocean temperatures are too warm, corals experience a stress response and expel the algae (zooxanthellae) living in their tissues. In a healthy environment, the algae and coral help each other survive. Using photosynthesis, the algae feed the coral and give them their color, and in return, the algae have a safe place to live. If the algae is expelled, the coral essentially starves, loses its coloring, and eventually dies.
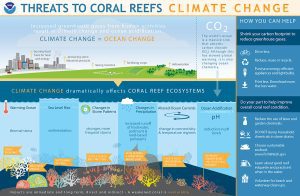
On top of warming, the ocean is becoming more acidic due to excess carbon dioxide absorption from the atmosphere. This change in the water chemistry makes it harder for corals to build their calcium carbonate skeletons.
Take a moment and think about what these reefs are up against—heat stress + acidification + pollution + disease + chemicals (even sunscreen ingredients like oxybenzone damage coral)—it’s adding up.
The Economic and Cultural Significance of Coral Reefs
It’s easy to get lost in the science and research on coral reefs. It is important to remember, though, that coral reefs also play a big role in shaping economies, traditions, and cultures.
Millions of people worldwide depend on reefs for food and even for their livelihood. The National Oceanic and Atmospheric Administration (NOAA) estimates that half of U.S. fisheries depend on coral reefs for survival. Local economies rely on people who visit reefs for recreational activities like diving, fishing, staying in hotels, and eating at nearby restaurants.
Moreover, coral reefs are interwoven into the cultural fabric of coastal and island communities in ways that can’t be captured in a spreadsheet or a graph. Indigenous communities hold generations of real, lived experience about how to live in balance with reefs. These communities have long understood coral reefs as living systems that must be carefully protected from exploitation. For centuries, they have embraced cultural practices that help to ensure food security, marine biodiversity, and coastal resilience. Strategies like small-scale artisanal fishing and rotational fishing, which allows the population to replenish, help to promote long-term ocean health. Cultural taboos also often dictate when fishing is allowed, harvesting limits, and even what species are banned.
Coral reefs are long-standing foundations for culture, food systems, and local economies. Protecting reefs means protecting the communities, traditions, and livelihoods that have grown alongside them for generations.
Examples of Coral Reef Destruction Around the World
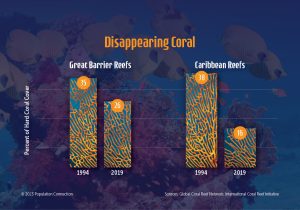
Examples of coral reef degradation can be found all around the world. Research out of Florida showed that after 10,000 years in Florida, two important coral species, elkhorn and staghorn, are now essentially gone. Scientists stated that abnormally high ocean temperatures wiped out the species, leaving the reefs without their key builders.
In Southeast Asia, the Coral Triangle is under threat from climate change, overfishing, and pollution. And Australia’s Great Barrier Reef is experiencing some of the worst effects yet, with marine heatwaves causing large-scale coral bleaching. These deadly events are occurring so frequently that they are now becoming a normal occurrence.
Can Reef Restoration Keep Pace with Human Impacts?
Around the world, scientists, conservationists, and even local citizen divers are experimenting with coral reef restoration to better understand how to stop coral reef destruction.
One popular method is coral gardening, where small pieces of healthy coral are grown in underwater or land-based nurseries. Once they’re strong enough, they are transplanted onto damaged reefs to help nature rebound more quickly.
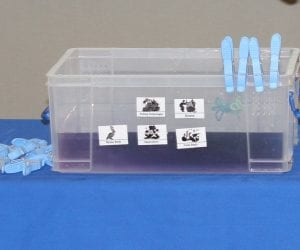
Another strategy involves creating artificial reefs out of eco-friendly materials. These structures give corals a fresh, solid surface on which to attach and rebuild.
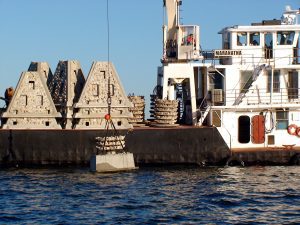
Artificial reefs being deployed.
Then there’s assisted evolution, where scientists identify coral species that can tolerate hotter, more stressful waters. The hope is that these tougher corals will give reef ecosystems the edge they need to survive a changing climate.
But sadly, we must face the stark truth: restoration is slow, expensive, and won’t keep pace with climate change on its own. It can take centuries for a single large reef to grow naturally. Restoration efforts are undoubtedly essential, but as individuals we need to proactively reduce our carbon footprint as well as our plastic and chemical waste. Reefs are in trouble and it’s not just an environmental crisis, it’s a human one. It is critical that as a global community we prioritize reef protection and restoration in the years ahead.
FAQ: Coral Reef Destruction
Q: What is coral reef destruction?
A: Coral reef destruction refers to the degradation and loss of coral reef ecosystems due to climate change, pollution, destructive fishing practices, and other human activities.
Q: What are the causes of coral reef destruction?
A: Climate change—especially ocean warming and acidification—is the leading cause of coral reef destruction, though pollution and overfishing also play major roles.
Q: How does the destruction of coral reefs affect humans?
A: It threatens food security, coastal protection, tourism, and livelihoods for millions of people worldwide.
Q: How to prevent coral reef destruction?
A: Preventing coral reef destruction requires addressing both climate-related and local human impacts. Reducing greenhouse gas emissions is critical to slowing ocean warming and acidification, which are the leading drivers of coral loss. At the local level, protecting reefs through marine protected areas, limiting pollution and runoff, promoting sustainable fishing practices, and avoiding harmful chemicals (such as certain sunscreen ingredients) can significantly reduce stress on reef ecosystems. Supporting conservation efforts and making responsible consumer choices also play an important role in protecting coral reefs for future generations.
Q: How can we stop coral reef destruction?
A: Reducing carbon emissions, protecting marine areas, practicing sustainable fishing, and limiting pollution are key steps.
Image credits: Colorful coral reef and blue seabed (Colorful coral reef and blue seabed by thomaseder151270435398 on Vecteezy); Coral (Bleached Staghorn Coral by Matt Kieffer is licensed under CC BY-SA 2.0); Coral reefs and climate change (Threats to Coral Reefs: Climate Change by NOAA National Ocean Service); Artificial reefs (Artificial reef deployment by MyFWC Florida Fish and Wildlife is licensed under CC BY-ND 2.0)