Resource Overview
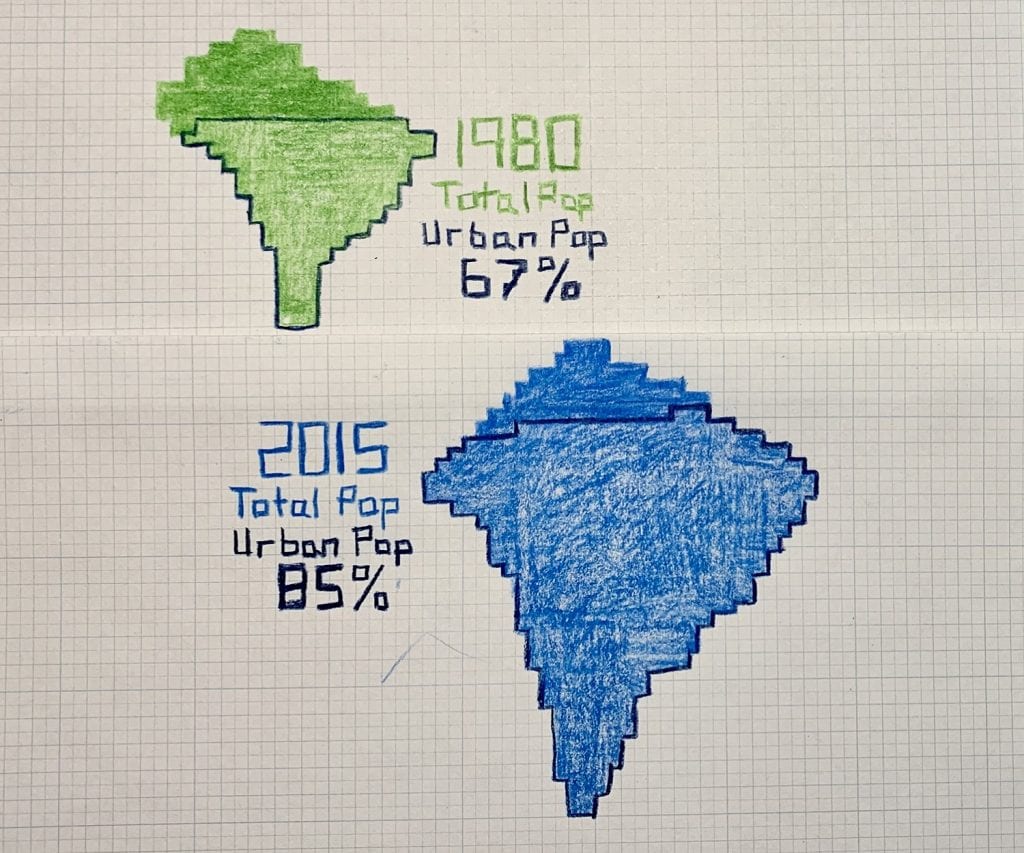
Students compare the World Population Map with an equal area map to calculate statistics related to urbanization and arable land.
Students will be able to:
- Read and interpret quantitative data represented on a population cartogram.
- Create visual representations of land and population data.
- Calculate and interpret a country’s ratio between land, arable land, and population.
- Interpret urbanization and land use data charts.
This lesson plan should be used with the World Population Map, a population cartogram.
Features of This Resource
- Students summarize and communicate the interconnections between population growth and various land types
- Real-world data on country level arable land
- Lesson plan utilizes students’ mapping skills
How Do I Get This Lesson Plan?
The resource is free. Click the green button for immediate download. Download Now
Other Resources You Might Like:
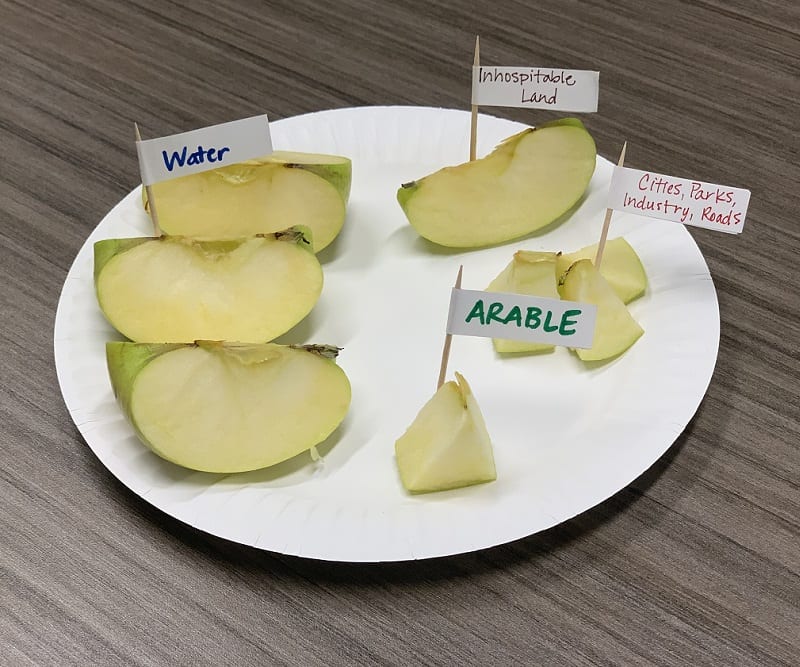
An apple is sliced into pieces to model the current amount of agricultural land on Earth. Then students read an... Read more »

Acting as different stakeholders with various interests, students play a strategy game where they work in groups to negotiate management... Read more »

In small groups, students analyze a map of an undeveloped area within a city in order to create and present... Read more »
Nice to meet you!
Tell us a bit about yourself so we can continue creating resources that meet your needs.
You’ll only need to fill out this form once. If you’ve already completed the form, you can confirm your email here.