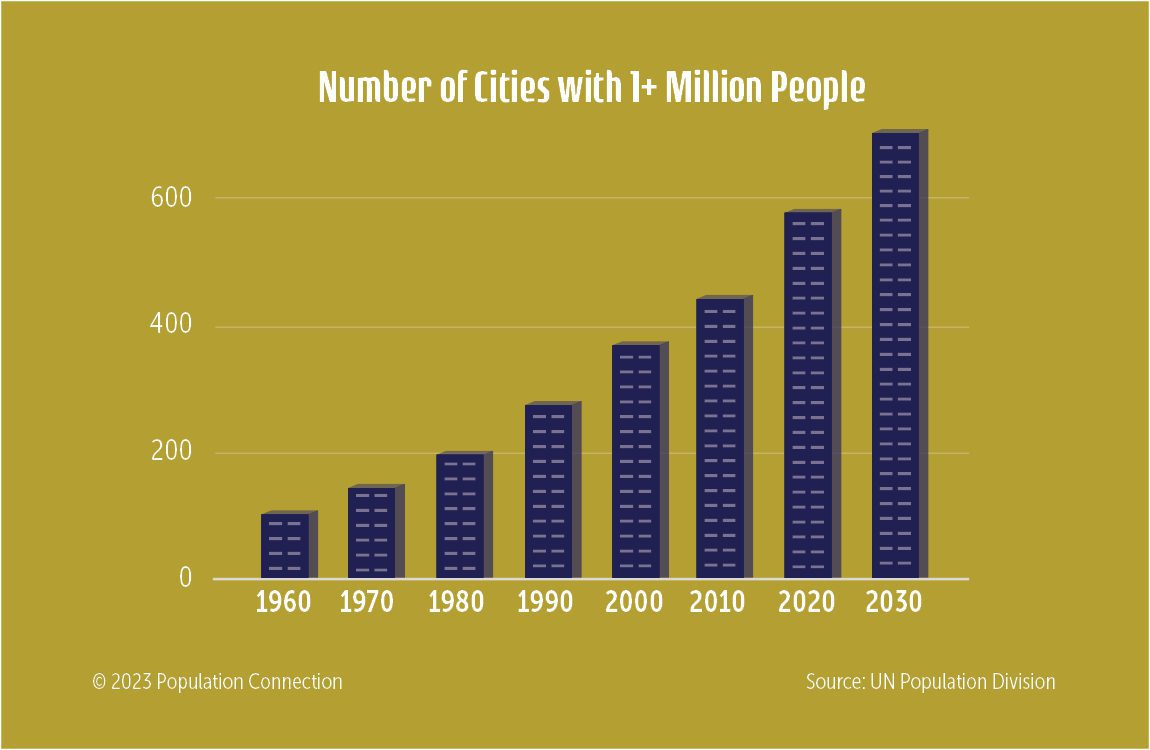
Graph shows the increasing number of cities with over 1 million residents over time. City data is displayed from 1960 to present and projected to 2030.
Data is from the UN Population Division.
Graphic originally published on the Quick Trip to 8 Billion wall chart.

Other Resources You Might Like:
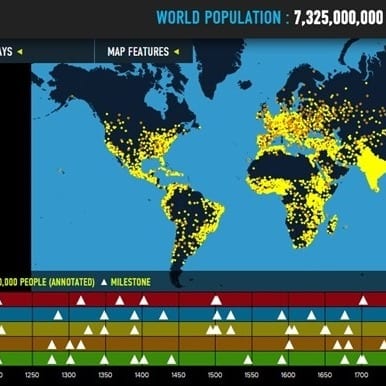
World Population History website
Interactive map of world population growth with annotated population "dots," data overlays, and thematic timelines.

Shenzhen: From Fishing Village to Megacity in 30 Years
Urbanization case study reading: A profile of the growth of Shenzhen, China.
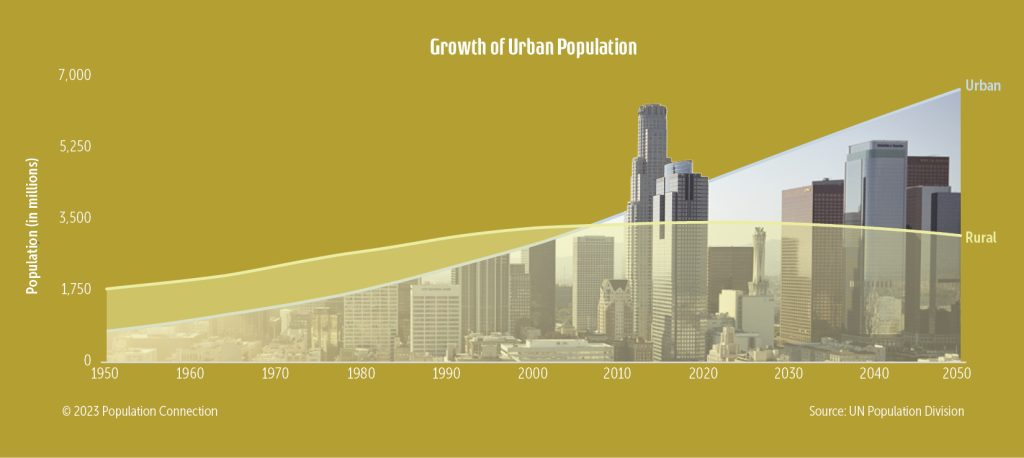
Growth of Urban Population infographic
Number of people living in urban areas vs rural areas starting in 1950 and projected to 2050.
Nice to meet you!
Tell us a bit about yourself so we can continue creating resources that meet your needs.
You’ll only need to fill out this form once. If you’ve already completed the form, you can confirm your email here.