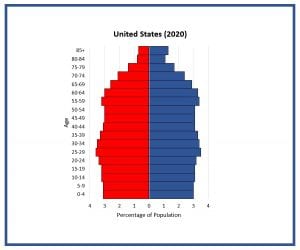
330 million people. According to the U.S. Census Bureau, that’s the estimate of our population in mid-2020. This, of course, is a decennial census year when we try to get a more accurate picture of how many of us there are living and working in this country.
Free Lesson Packet Focuses on U.S. Demographics, History, Economics and More
A census year is a great opportunity to take stock of national population trends, as well as indicators of national progress over the sweep of U.S. history. This is what motivated us to create a new set of lessons for your middle and high school students, 330 Million in the USA. As you might expect, the lessons examine trends for our nation’s population growth and settlement patterns, but they also explore so many other aspects of American life, from family size and education to health, immigration, gender roles, political representation and environmental policies.
The last time we released a U.S.-focused curricula was in 2006 when our country’s population reached the 300 million milestone. A lot has changed in the intervening 14 years and we didn’t want to just update old lessons (although we have retained and refreshed a few of our most popular ones from that set).
Data-Rich Lessons Meet Teaching Standards
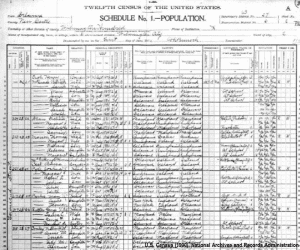
In creating this new curriculum, we looked to themes and content standards for a range of social studies disciplines – U.S. History, Civics/Government, Geography and Economics – as well as Environmental Studies and Statistics. We were especially mindful of the four dimensions of the C3 Framework (College, Career & Civic Life) for Social Studies State Standards. Accordingly, many of these lessons include rich data sets and primary sources from the past 230 years, including historical census data, archival footage and some of our nation’s most important documents.
Here are examples of new lessons with historic primary sources:
- People’s House – Students analyze historic primary and secondary sources, like the Federalist Papers and a New York Times article from 1929, to prepare for a debate on the size of the U.S. House of Representatives.
- Making It in America – Using mathematical models, students compare actual and perceived wealth distribution in the U.S. and analyze historic documents, like the original Social Security Act, related to the American Dream.
But the lessons aren’t just a look back at the past. They also give students an opportunity to analyze current data (e.g. government statistics, think tank reports, Google Maps) that help us understand the present moment as it relates to all of these topics. We can then use these insights to assess our present reality and plan for the future well-being of our country.
Today’s middle and high school students (Gen Z) will need to examine where we’ve come from in order to assume their future roles as innovators and civic leaders.
Thematic Readings and Colorful Infographics for U.S. History
To enhance the lesson plans, 330 Million in USA also includes readings on historical trends in the U.S. related to education, work, family, transportation, diet, and environmentalism, and how Gen Z fits into these trends. A set of infographics also marks changes over time in population, housing, immigration and wealth.
- America Pairs Up – One of six student readings, this gives a brief background on the history of courtship, marriage and family compositions in the U.S. Reading is an easy-to-share, or print, PDF.
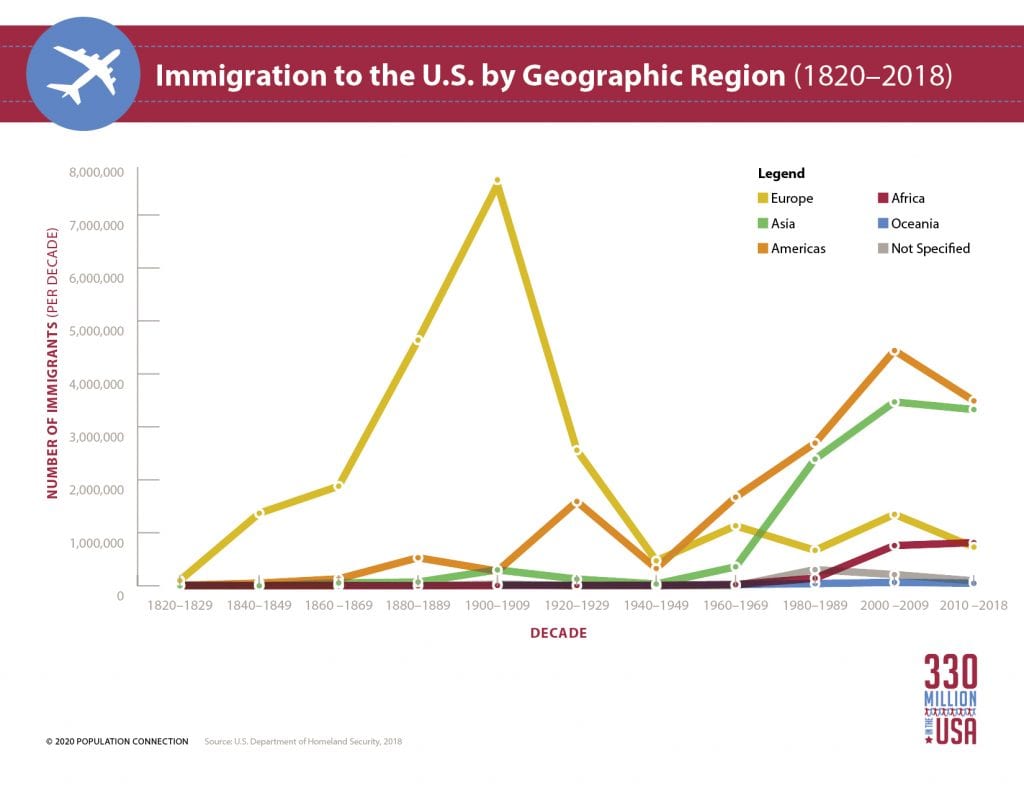
- Immigration to the U.S. – Line graph displays the number of immigrants to the U.S. by home region over time. Infographics are available as a JPEG or PDF, making them easy to include in a slide deck or share electronically.
Lessons are Appropriate for Virtual Classrooms
Most of the new lessons work well outside of the classroom, making them appropriate for our present situation of distance learning. Here are a few highlights of new lessons that are great for an online classroom:
- Family Counts – Students analyze historic census datasets and make correlations between family size trends and a range of social and economic indicators. Electronic worksheets are easy to share when distance learning.
- Our Shared Environmental History – After researching events in U.S. environmental history, students create a class timeline (options for an online timeline included), and then write op-eds on the long-term success of Earth Day as an agent for change.
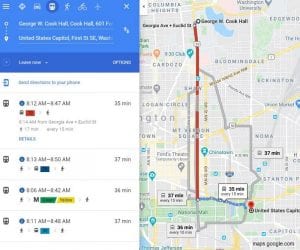
- Let’s Go! – Students use interactive mapping to find out how four different cities’ transportation infrastructures determine our travel habits and CO2 emissions. This lesson is ideal for a virtual classroom unit on human impacts on the environment.
Each of the components of 330 Million in USA is available for free download (14 activities, 6 readings, 6 infographics). In the coming weeks, we will also be posting the complete set as a downloadable booklet.
Image credits: 1900 U.S. Census sheet (National Archives and Records Administration. 1900 U.S. Census, Wilmington Hundred, New Castle County, Delaware, SD 27, ED 6, sheet 2, pp 474 https://archive.org/details/12thcensusofpopu154unit/page/n473/mode/2up accessed 7 March 2020)