Earth: Apple of Our Eye is arguably one of Population Education’s most popular lesson plans. It was therefore with some trepidation that we set about updating the activity. We know that hundreds of educators have used this lesson, and want to make sure any changes we made were necessary and accurate. We’ve already shared an overview of the updates to the activity’s procedures and content. Here we’ll take a closer look at the data we used, how we organized it, and specifically what each category includes.
The History of This Lesson
We originally adapted this activity from a Native American science education association called Kui Tatk that is no longer active. To the best of our knowledge, we’ve been using the same fractions since at least 1989 and probably longer. We also no longer have records on how that original data was gathered and exactly what each category represented. We suspected that the fractions were out of date, and it made sense to revisit these numbers to see if they were still accurate.
Was the Data Still Accurate?
Our first hint that the data in the lesson might need significant revision came from the Our World in Data infographic Global Land Use for Food Production. This infographic uses statistics from the United Nations Food and Agriculture Organization (FAO). We were unsure, however, if the infographic was based on the most recently available data. So we decided to pull our own numbers from the FAOSTAT database to see if we could recreate the percentages in the infographic.
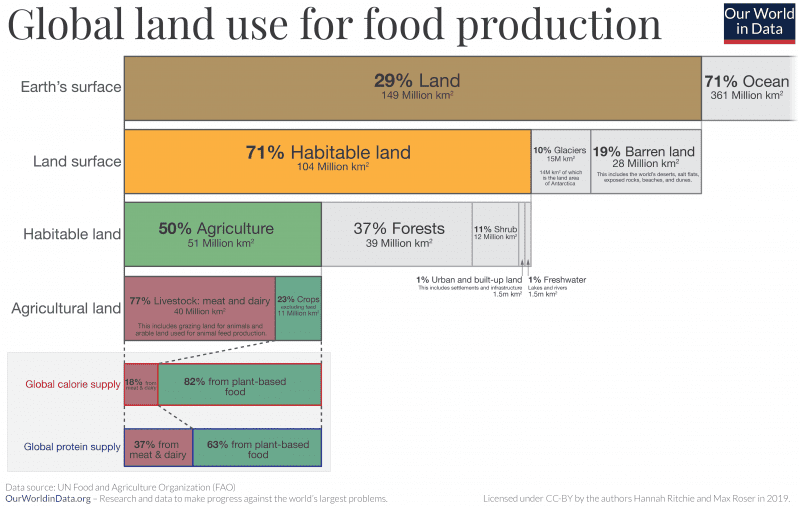
Hannah Ritchie and Max Roser (2013) – “Land Use”. Published online at OurWorldInData.org. Retrieved from: ‘https://ourworldindata.org/land-use’ [Online Resource]
We used data from 2018, since that the latest year where both datasets are available. Neither dataset neatly aligned on its own. We needed to compare details within each data set to recreate the fractions in the lesson. The FAO also calculates land cover using two different sources: MODIS and CCI-LC. We compared numbers in both. In the end, because we convert all data to fractions that can be cut into an apple, discrepancies and variations in the data were not significant enough to impact the apple’s fractions.
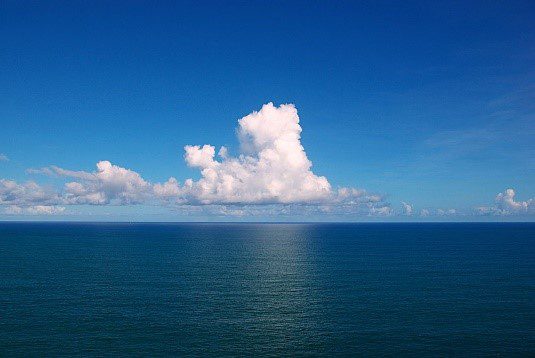
Percent of Earth covered by water: 72%
We used a combination of the FAO land cover dataset and a data point from NASA for this category:
- Oceans 71%: The FAO land cover dataset does not include a statistic for how much of the surface of the Earth is covered in ocean. We used the total surface area of Earth as reported by NASA (about 510 million km2) and subtracted the total land areas reported in the FAO land cover data set to get this number. Our number was consistent with several other organizations, and with the number used by the Our World in Data infographic above.
- Inland water bodies 1%: The FAO includes both natural and man-made lakes, reservoirs, rivers, streams, ponds, canals, and dams in this figure.
- Costal water bodies and intertidal zones 0%: These areas are sometimes covered in ocean and sometimes not, due to advancing and receding tides.
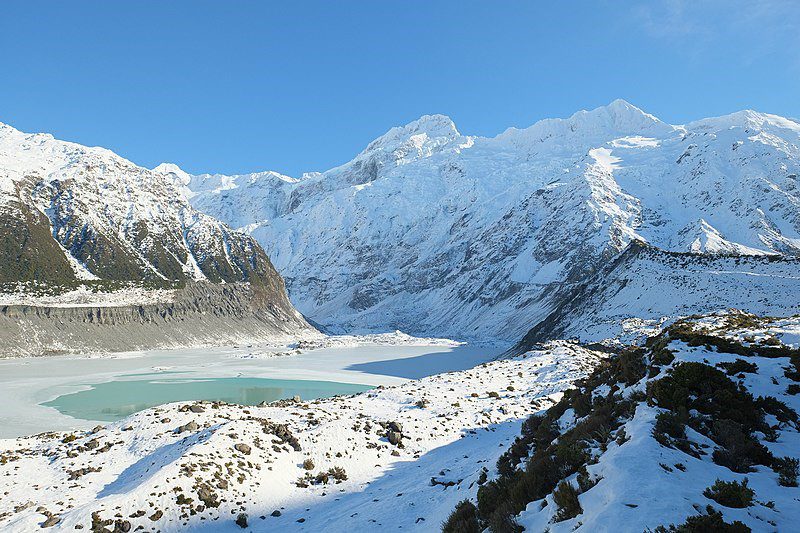
Percent of Earth that is uninhabitable land: 7%
The FAO land cover dataset includes two categories that we combined to determine uninhabitable land in this lesson:
- Permanent snow and glaciers 3%
- Terrestrial barren land 4%: This includes bare rock (like mountains and exposed desert bedrock), sandy areas (dune along the ocean as well as inland dunes), salt flats, and strip mines or quarries.
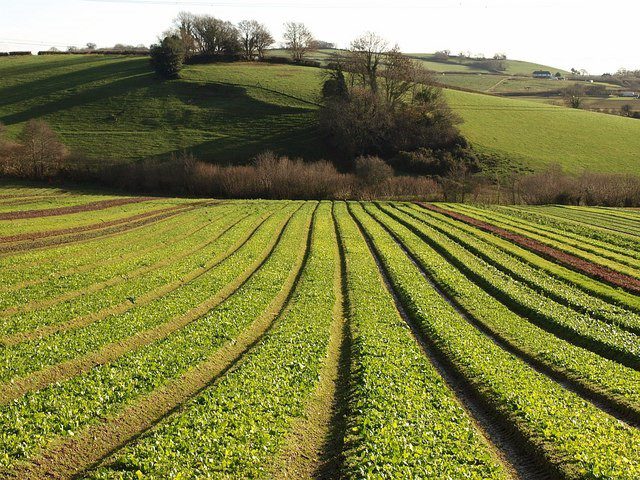
Percent of Earth that is habitable land used for agriculture: 9%
Agricultural land in the FAO land cover dataset covers a variety or permanent and temporary agricultural practices. It’s defined as land used for the cultivation of crops and animal husbandry. There are two main categories of agricultural land:
- Cropland 3%: This category includes two subcategories:
- Permanent crops 0.3%: crops like grape vines or coffee that do not need to be replanted each season.
- Arable land 3%: land used to grow temporary crops like wheat or corn that need to be replanted each season. Arable land also includes land used for small kitchen gardens, land that may be currently fallow but will be used to grow crops in the future, and land used for temporary or seasonal pasture for grazing or that is mowed for livestock feed.
- Land under permanent pasture 6%: This land has been used for five or more years for forage for livestock. It can include naturally seeded plants or cultivated crops.
Percent of Earth that is habitable land not used for agriculture: 10%
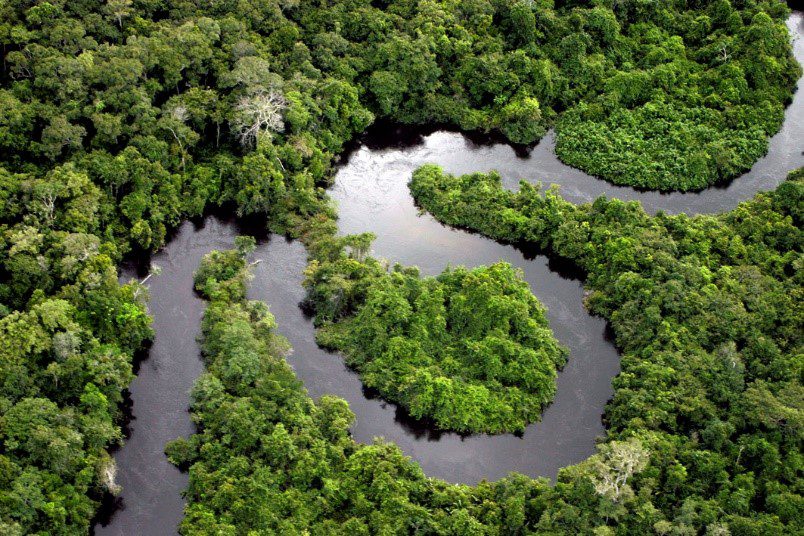
This category was the most difficult to determine, as neither the land use or land cover data sets had categories that neatly fit into this section of our lesson. We wanted the section to include all land that was habitable (a data point from the land cover set) and that was not used for agriculture (a data point from the land use set). This section would include wild forests and grasslands (not used for temporary or permanent crops or grazing) and urban and built-up lands where we live.
If we used the land cover dataset, we could determine how much land was habitable. But we could not determine how much was agricultural or not. For example, the category for “tree-covered areas” could include both wild rainforests and groves of cultivated almond trees lumped together.
If we used the land use dataset, we could determine how much land was used for agricultural purposes, but we could not subtract inhospitable land. The “other” category in this data set includes inhospitable land, as well as areas of human development, land not being used, land used for the maintenance of environmental functions, and even aquaculture.
In order to determine what constituted the “habitable land not used for agriculture” section for this lesson, we started with the land use dataset. We subtracted agricultural land from the total land area. This left us with all land on Earth not used for agriculture. Then we revisited the land cover data set for the total area of inhospitable land. We subtracted inhospitable land from the land not used for agriculture. We believe this leaves us with a total for habitable land not used for agriculture.
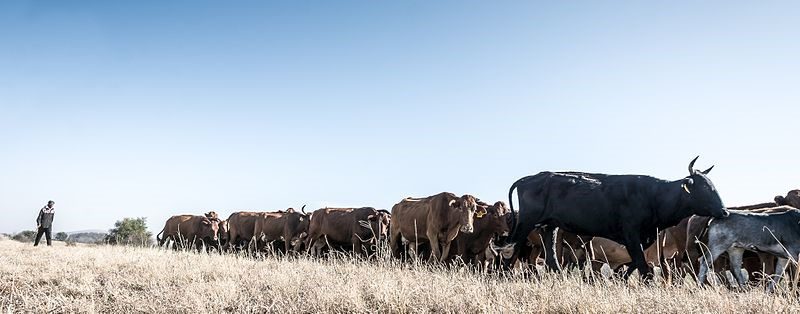
Percent of agricultural land used for livestock consumption: 77% of agricultural land, or 8% of the Earth
We used the percentage reported by Our World in Data for this last statistic. They base the stat off of a 2017 FAO study and data from a 2018 Poore and Nemecek study. It is very important to note that most of the land used for livestock tends to be pasture on marginal lands that could not support crops for human consumption, and much of the grain that livestock eat (86% of feed) is not suitable for human consumption. So the idea that we could feed more people off of potential crops grown where cows are now eating, or by rerouting livestock feed to people, is a very problematic claim.
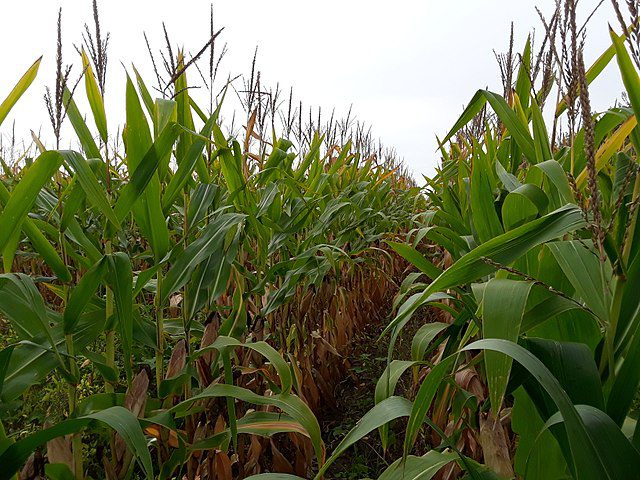
Percent of agricultural land used for inedible crops: around 5.5% of agricultural land, or 0.5% of the Earth
We also know that some agricultural crops are not grown for consumption by people or animals. Products like jute, flax, and castor oil are included in the FAO land use category for cropland, as are crops used for biofuels like corn. Some of these individual crops can be tricky to parse out their use using FAO data. For example, corn could be used for human consumption, livestock consumption, and/or biofuel, sometimes from the same farm. A coconut farm could be used for human consumption and fiber production from the same trees.
We pulled a breakdown of the land area used for individual crops as reported by the FAO. We grouped these crops into primarily edible and primarily inedible crops. Altogether, inedible crops comprised about 5% of cropland and 0.1% of the surface of the Earth. The inedible crops with the largest footprints were cotton, palm oil, and rubber.
We had to look to another source for estimating the land area used to grow biofuels. According to this 2016 study out of the University of Virginia, only about 4% of agricultural land goes to producing biofuels, or about 0.4% of the surface of the Earth.
Determining the new fractions
Using our updated data as a starting point, our last step was to determine new fractions to cut up the apple. We knew that we would lose some precision in this step. The fractions needed to be reasonable estimates, but also needed to be manageable for teachers to cut an apple in a classroom. We found that using the new fractions below actually helped us account for some of cropland used to grow fiber, biofuel, and industrial crops, as our agriculture section was smaller than the FAO’s agricultural land (that included both edible and inedible crops).
We believe we have struck the best balance between updating the data and having a reasonable procedure for teachers to follow in the lesson plan. We also have a clearer understanding of the exactly which portions of the Earth are included in each category in our lesson. The revision not only makes the lesson more accurate, it informs how we view and use the lesson, and guided the content revision to accompany the apple-cutting.
Percent of land that corresponds to each of the lesson categories, by dataset (excluding the 72% of the Earth covered by water):
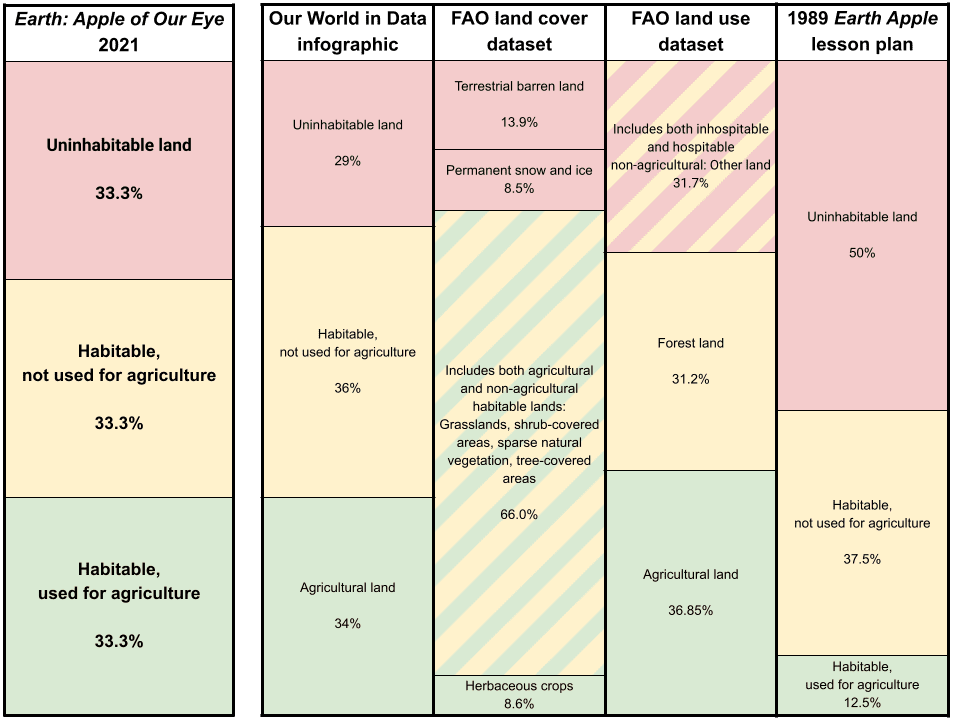
Image credits: Land Use (Global land use for food production is licensed under CC BY 4.0); Ocean (Clouds over the Atlantic by Tiago Fioreze is licensed under CC BY-SA 3.0); Mountains (Frozen Mueller Lake by Pseudopanax@Wikimedia is licensed under CC BY 4.0); Farmland (Derek Harper / Crops, Riverford / CC BY-SA 2.0); River (River in the Amazon by Jlwad is licensed under CC BY-SA 4.0); Cows (Cattle herder by Deon TerBlanche is licensed under CC BY-SA 4.0); Corn (Field of corn plants by Spartacon3000 is licensed under CC BY-SA 3.0)