Simply put, a cartogram is a map. But a cartogram is a unique type of map because it combines statistical information with geographic location. Physical or topographical maps show relative area, distance, and terrain, but they do not provide any data about the inhabitants of a place.
Cartograms on the other hand take some measurable variable: total population, age of inhabitants, electoral votes, GDP, etc., and then manipulate a place’s area to be sized accordingly. The produced cartogram can really look quite different from the maps of cities, states, countries, and the world that are more recognizable. It all depends on how a cartographer needs or wants to display the information.
Cartograms come in all shapes and sizes, literally, and with the continuous advances in technology of geographic information system (GIS) software cartograms are produced with more precision and greater graphics than ever. There are two main types of cartograms: area cartograms and distance cartograms.
There are two types of cartograms
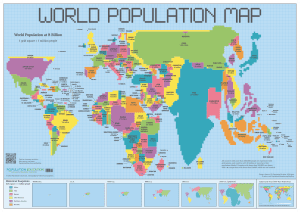
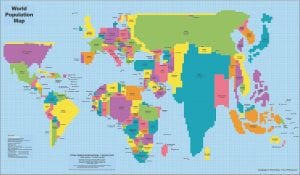
An area cartogram is a map that alters an entire physical location by scaling a chosen economic, social, political, or environmental factor. Take total population for example, the area cartogram to the right displays the current world population of 7.2 billion people. In this cartogram the size of a country is built using square grids, each representing 1 million people – the larger the total population, the larger the country. Anything striking?
The second type of cartogram is a distance cartogram. In this form, cartograms are used to display the relative time and distance within a chosen network. If you have ever ridden on a subway or metro you have most likely used a distance cartogram. Though the exact time and distance from one location to another is distorted, these cartograms are still useful for moving about. One distance cartogram familiar to many Americans is the metro system of Washington, DC. The distance between stops seems uniform when in fact the actual distance between one stop and another may be far greater or far less than displayed on the cartogram. In either case, statistical information dictates how physical geography will be mapped.