Grade Level:
3-5
Teacher Resources
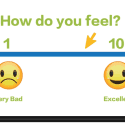
In this engaging two-part elementary lesson, students first explore the impact of outdoor environments on their mood...
In this interactive lesson, elementary students work in small groups to design and build 3-D model communities...

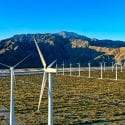
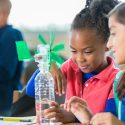
In this climate change lesson, students solve real-world word problems and use packing peanuts to visualize the...
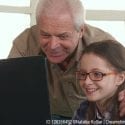
Students explore the reasons, benefits, and challenges of moving from one place to another by interviewing two...
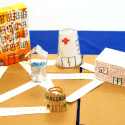
Small groups construct 3-D communities using various amounts of funds and then compare the communities to gain...


PopEd Impact
campuses
"The activities not only bring out important content, but they also provide real-world context for environmental, population and sustainability issues. They engage participants in very thought-provoking and critical-thinking discussions.”
Helen de la Maza, Environmental Educator, Irvine, CA