The Next Generation Science Standards and Common Core Standards emphasize students’ ability to collect, analyze and interpret data. In both sets of standards, analyzing and interpreting data is framed as a central practice in the sense that it relates to all other practices – developing and using models, using mathematics and computational thinking, developing explanations and designing solutions, and so on.
This begins at the elementary level when students can begin to share data observations verbally and written, and in upper elementary when students focus on quantitative measurement to evaluate data. In the middle grades it becomes increasingly important to incorporate quantitative analyses in investigation, to distinguish between causation and correlation, and to use statistical information. By high school, students learn to use computational and mathematical models to aid in data collection, analysis, and interpretation.
Teaching with Real-World Data
Why so much emphasis on data analysis in the standards? The challenges facing the next generation are great, and tackling them will require not only creativity, but also the ability to transform data into evidence and use it to inform explanations, models and arguments. Whether investigating wealth inequality, climate change, food production or biodiversity levels, data will be key to not only understanding the depth of the issues we face, but also critical for finding solutions that work.
We understand the importance of data analysis skills and build it into PopEd’s curriculum – lesson plans use current and historic demographic statistics as well as data that stems from real-world issues like fossil fuel emission data, or consumption data. This allows students to work with numbers that are relevant to them while also reflecting the world we live in.
Data-Centric Lesson Plans for All Grade Levels
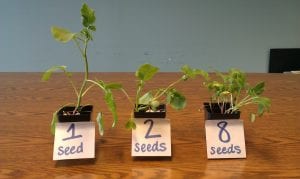
Grades K-2 Data Lesson: Crowding Can Be Seedy
In this activity, lower elementary students learn about the effects of crowding on living things. Through a short song and role play, students explore the various resources that plants need to thrive. During the role playing portion, students are physically representing data as more and more students step into a circle (which represents flowers in a pot). In part two of this lesson, students investigate a plant’s life cycle – they make observations of plant growth over time and record results by writing, drawing, or verbally sharing data about the planet.
Grades 3-5 Data Lesson: People Count
In this upper elementary activity, students conduct a mini-census either at home or at school. They learn to gather and display data (in this case, local demographics) in various forms such as in tables and graphs. Students also practice comparing data across groups and better understand why we collect demographic data in the first place (in this case, the data could help assess how many supplies a class needs, or how many desks and chairs).
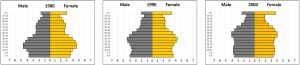
Grades 6-8 Data Lesson: Mysteries of the U.S. Pyramids
In this activity, middle schoolers use United States population data to construct population pyramids, which display age and sex data in 5-year age cohorts. In doing so, students are able to make correlations between the shapes of the graphs and societal characteristics that may have affected U.S. population patterns at different time periods.
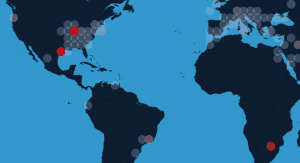
Grades 9-12 Data Lesson: Carbon Crunch
In this high school level activity, students work in small groups to determine the main environmental concerns during given periods of history. Students then analyze both historical and present day data on carbon emissions to see how countries differ in terms of CO2 emissions and vulnerability to climate-related risks.
We hope these lessons have given you concrete ideas and easy access points for integrating real-world data into the classroom. Whether they’re kindergartners or high school seniors, your students are sure to benefit from both the exposure and analysis of authentic data.