In Auburn, Alabama, Christopher Graff combines population data with city maps to tell stories about Auburn’s changing demographics. He is the city’s Deputy Chief Information Officer, and an example of one person that uses population data in their job on a regular basis.
Auburn is one of the fastest growing metropolitan areas of its size in the nation. Like other quickly changing cities, this comes with unique challenges. Mr. Graff’s team takes population information, maps it, and discovers trends that inform Auburn’s policies for the future. They map everything from the sewer lines to library locations. When these maps are combined with new data sets, like student population, they can draw powerful conclusions about how Auburn is changing.
Using Geographic Information Systems (GIS) to Map Auburn’s Students
The number of students in the Auburn public schools grew an average of 4% annually from 2012-2018. With this high level of growth, Auburn knew that it needed to invest in schools before the existing schools reached over-capacity. Policy makers had to know how many new schools were needed, when the new schools should open, and where the new schools should be built within the city.
Each fall, the school district provided Mr. Graff’s team with information on every student. The data included addresses, grade levels, ethnicity, if the student rode the bus, if they received a free or reduced lunch, and other details. The information did not include student names. He combined the school data with data from other city departments and then went to work putting all of the anonymous students on a city map.
With the population data mapped, they could begin to explore trends. They could estimate the number of students that would need a seat in a ninth grade classroom in two years and see which schools had the highest percentage of new residents. They could look at the diversity of each school’s population and predict how it would change. They could see if percentages of students needing English language support increased or decreased at any school. Based on the school population data, Auburn added a new high school and three elementary schools to the district. They doubled the capacity at the junior high and are drafting plans for an additional high school and elementary school to open in a few years.
All of this growth requires funding. While the school district grew an average of 4% since 2012, the city itself was only growing at 3%. There was a higher rate of school-aged children moving into the city than tax payers, resulting in a tax base that couldn’t keep pace with the school’s growth. Auburn diverted funding from other departments to fuel the school system’s expansion. The city also needed to plan for long-term growth in their tax base. They turned to the student population data and GIS mapping to understand the implications of the city’s growth on property taxes.
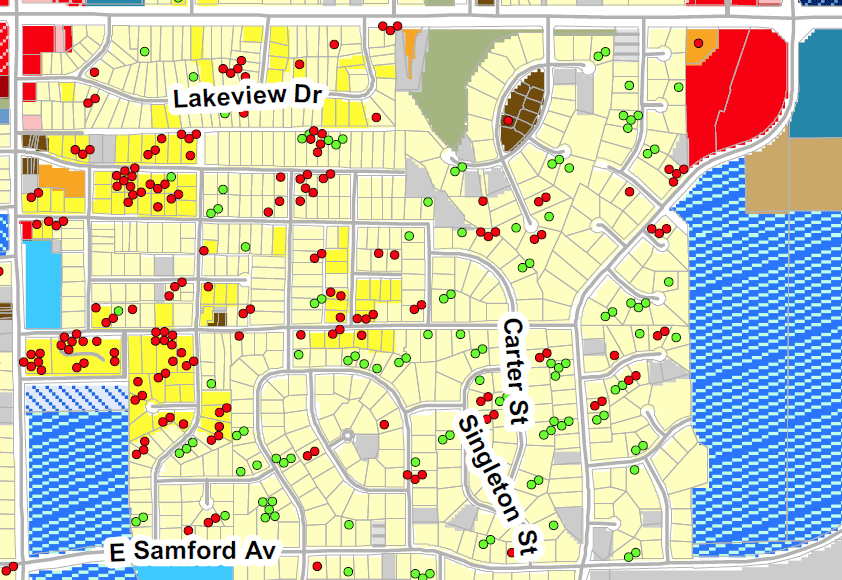
Detail from the map of student population data overlaying property ownership. Each dot represents an Auburn public school student. Green dots represent homes that are owned by the student’s family; red dots represent homes that are rented. Background colors represent the different types of buildings, zones, or land ownership.
Challenging Assumptions with Population Data
Policy makers in Auburn noticed a large percentage of new incoming families were staying in rental apartment complexes, mobile home parks, and hotels. They worried that these new residents wouldn’t pay property taxes and without the taxes, it would be significantly more challenging to fund a growing school system. Based on this assumption, policy makers considered blocking construction permits for all new high-density rental housing developments in order to curb the influx of new residents.
But Mr. Graff’s team noticed a different trend by studying the annual school population data combined with the city’s housing data. They followed new students in Auburn for seven years. They found that in the first year or two, many new students did live in rental housing in high density areas, but that within a year, most of these families purchased single-family homes and began paying property taxes. This meant that the city could advocate for additional construction permits for high density housing and also expect to see long-term growth in the tax base for the city. The policy-makers cancelled the moratorium on apartment construction permits.
Developing Data and Mapping Skills in Students

Christopher P. Graff, Deputy Chief Information Officer for Auburn, AL
Technology is evolving at such a fast rate, that it can be hard to predict what tools will be used to analyze population data in the future. Mr. Graff uses GIS mapping technology and relational databases in his work. However, these tools evolve quickly and he suggests that students interested in data-mapping fields practice important soft skills as well.
Mr. Graff says that learning to ask good questions is the single most important skill he uses. His team is always trying to find the next question that will bring understanding about life in Auburn. It takes keen observation skills to explore data, see all aspects of their community, and know what questions to ask to understand underlying trends. “My studio arts background probably prepared me the most for this career. It taught me how to really look at things, to use all of my senses to explore, to find limitations in an object, to understand by seeing things in different ways.”
Once his team has a chance to observe trends, ask good questions, and apply data and maps to finding answers, then they need to share their analysis with policy makers in Auburn. The arts background helps Mr. Graff tell complicated stories in appealing and accessible ways. He describes GIS and data-mapping as a different kind of story-telling narrative with visual elements. “Our job is to provide the best services to our citizens. We can’t do that unless we know where our citizens are, what they are doing, and what they need.” As an Information Officer, it’s Mr. Graff’s job to help tell that story for Auburn.
Image credits: Student population map: City of Auburn GIS Division; C. Graff: With permission