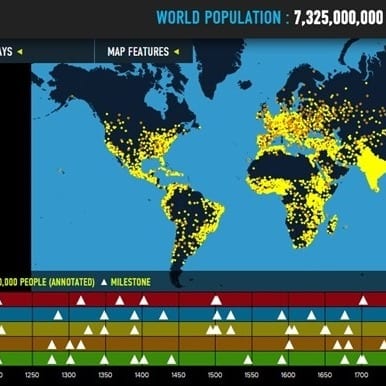
The cornerstone of World Population History is an interactive map of the world, where dots represent human population (one dot = one million people). At any time between 1 CE and 2050, you can zoom in on the map and click on individual dots to learn more about the population of that area. Turn on any number of map overlays to see how fertility rates, carbon emissions, land cover, and life expectancy have changed around the world as population increased. A historic timeline accompanies the map, offering context to the population numbers indicated on the map. Milestones relating to food, technology, people and society, health, and the environment inform about events, inventions, and social movements that have impacted human numbers over time.
Four contextual readings and six classroom lessons plans are available to help teachers utilize the site in the classroom. These detailed, teacher-friendly lessons incorporate a variety of the site’s features as well as hands-on simulations that are sure to be meaningful and memorable.
WorldPopulationHistory.org is a must-use resource for anyone teaching about human population growth!

Features of This Resource
- Perfect tool for high school technology integration and distance learning
- Five map overlays let you see another data set on the map with population. Overlays include: urbanization, fossil fuel, CO2 emissions, fertility rate by county, life expectancy by country, and land use.
- Fun “attention grabbers” for students, like #MyPopNumber – enter your birthday and find what number person you were on the planet
- Home of the World Population “dot” video
- Interactive graph the the UN’s population projections for 2100
Other Resources You Might Like:

Population dynamics background reading: An overview of world population history, current demographic trends, migration, and the concept of carrying capacity.

Students analyze data and images about three megacities, identifying challenges and benefits of growing urbanization, and then collaborate in small... Read more »

High school lessons cover global interdependence in ways students find meaningful and relatable.
Nice to meet you!
Tell us a bit about yourself so we can continue creating resources that meet your needs.
You’ll only need to fill out this form once. If you’ve already completed the form, you can confirm your email here.


