The term “population pyramid” is a catch-all phrase to describe all age-sex distribution graphs that depict a population’s demographic structure. Though many such graphs are shaped like pyramids, not all are.
Pyramid Shaped Graphs
Pyramid-shaped graphs indicate a high population growth rate where the younger age groups, called cohorts, are larger than the older ones. This bottom-heavy graph is typical of many countries with young populations, especially in sub-Saharan Africa and Southeast Asia.
Pillar Shaped Graphs
In countries where population growth rates have slowed, the cohort sizes are more similar, leading to a pillar shape. This is especially true in countries that have had a roughly two-child average (replacement-level fertility) for at least a couple of generations.
Diamond-Shaped (Top-Heavy) Graphs
And then there are the graphs that look more like a diamond than a pyramid – wide in the middle and tapered on the bottom and top. Think of the diamond like a pyramid atop an inverted pyramid. These indicate a structure where middle-aged cohorts make up a larger and larger segment of the country’s population and the younger cohorts have gotten smaller over time. Typically, these are countries with low fertility rates (<1.5) – well below replacement level. The population of older residents is also expanding, as life expectancy rises. In 2021, there were over 40 countries whose senior population (65+) was larger than its population of children (<15) and that number is expected to rise in the coming decades.
Let’s look at examples of three places with these diamond-shaped graphs: South Korea, Italy and Puerto Rico. In all three examples, the reasons behind the graph shapes are multidimensional and include economic and cultural factors that have influenced childbearing decisions.
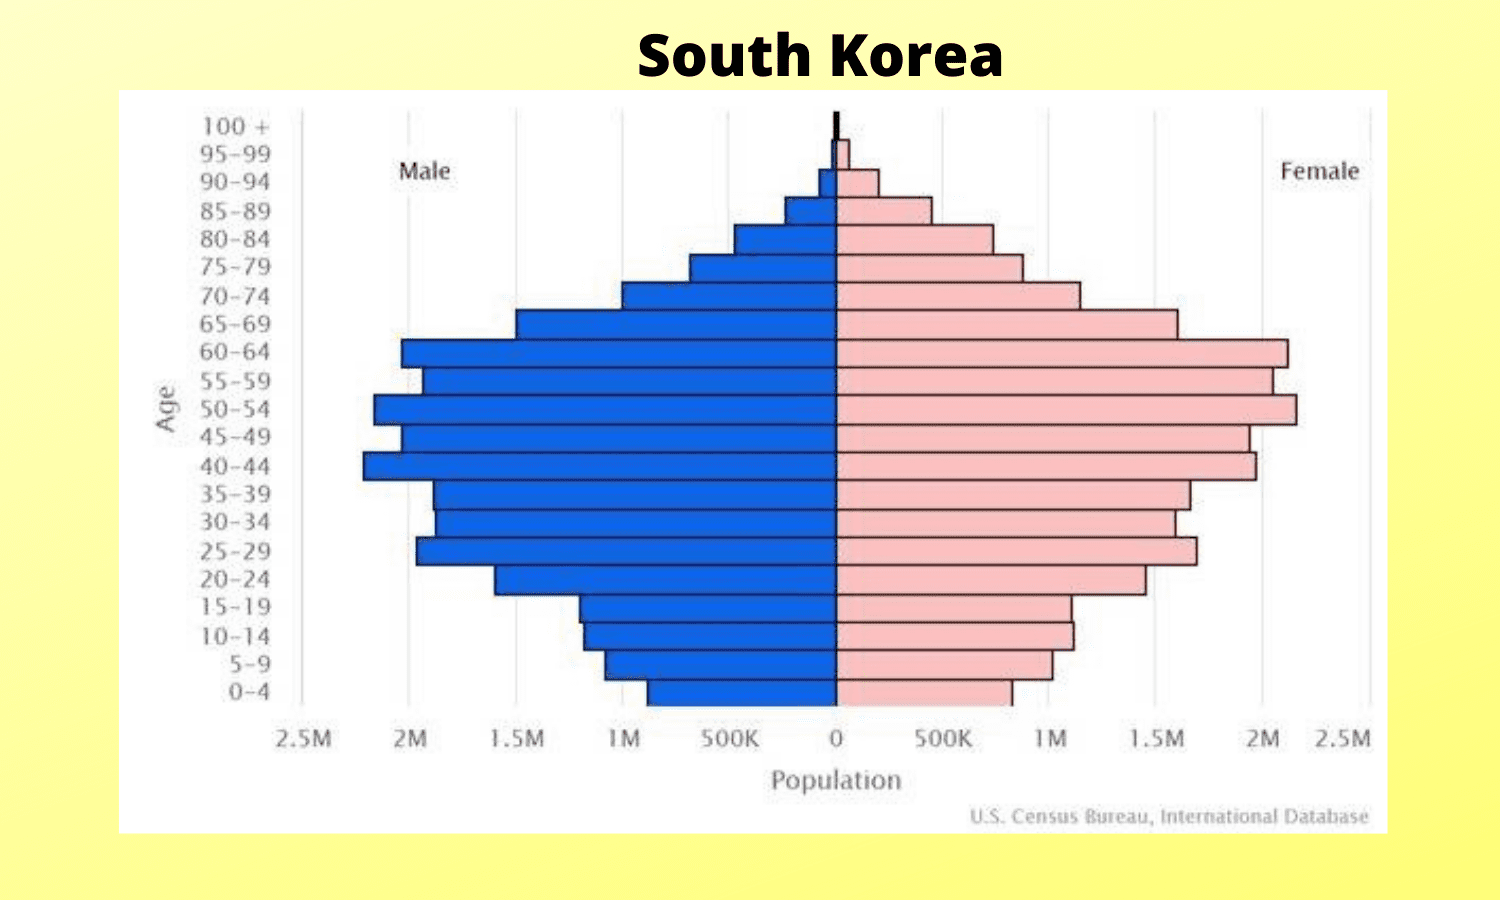
South Korea’s Population Pyramid
South Korea has the lowest fertility rate in the world at 0.8 children per woman. This is significantly lower than the average of the most developed countries in the world (1.6 for the 38 OECD countries). Reports show that marriage rates and childbearing among young adults have been in decline for some time amidst a prolonged economic slowdown and sky-high housing prices. Half the country’s population lives in the Seoul area, where a typical apartment costs $1 million. Many South Korean parents prioritize an elite education for their children which can amount to nearly half of their income for just one child. The country also ranks low on gender equality among developed countries with traditional gender roles clashing with women’s career plans, and corporate culture making it difficult to balance work and family life. Restrictive immigration policies have also influenced the country’s demographic structure. In a number of countries in Europe and North America with falling birth rates, immigrants have stabilized the cohorts of younger and working-age residents.
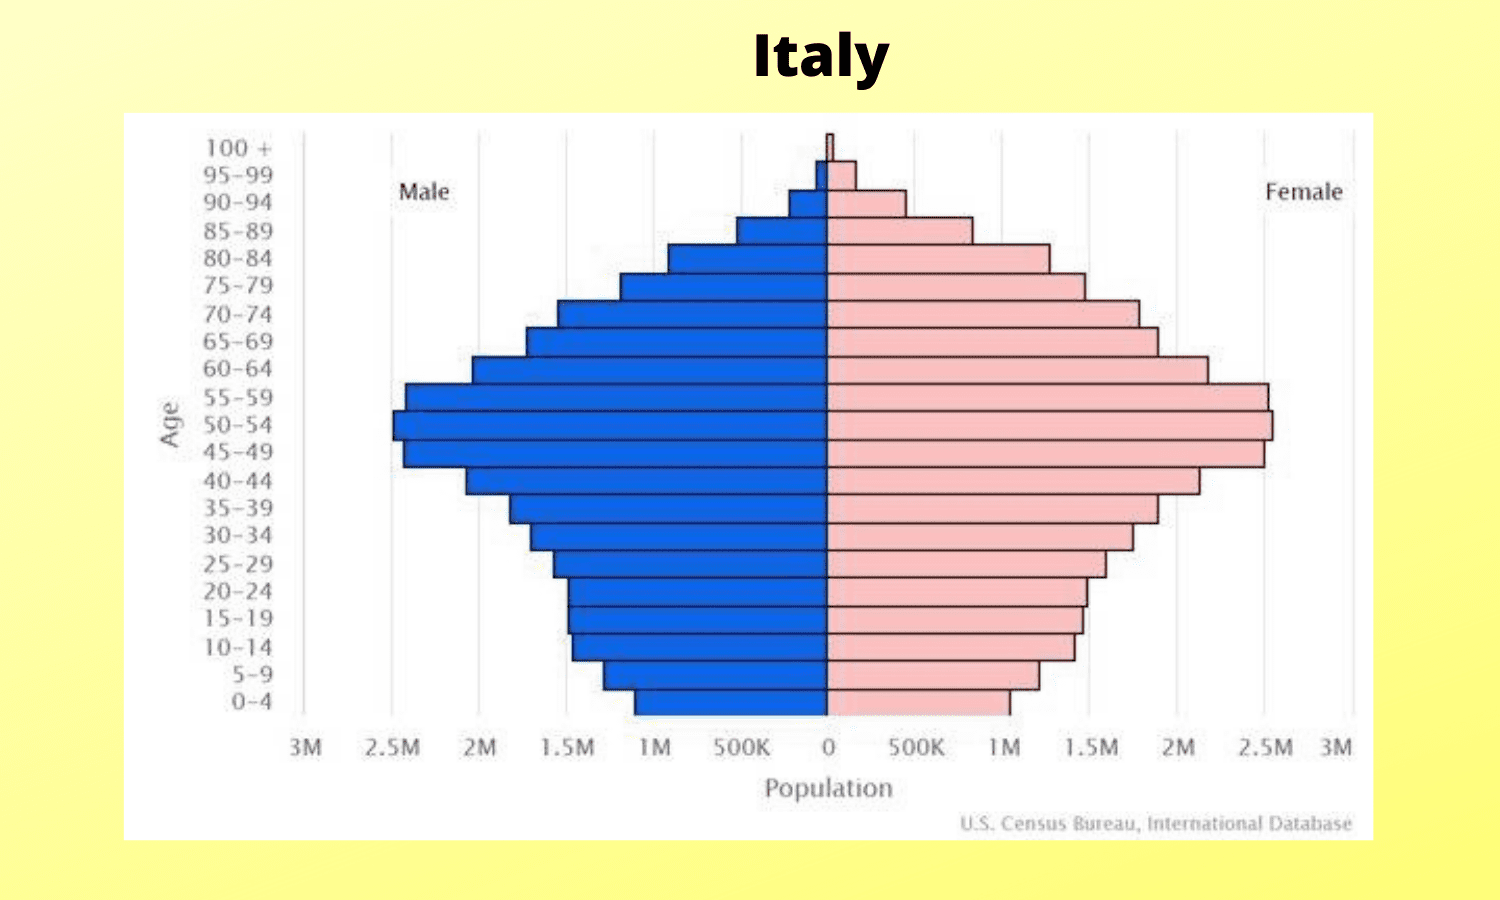
Italy’s Population Pyramid
In Italy, where the fertility rate is 1.2, there is a desire for more children but young adults put off childbearing, citing high unemployment, lack of affordable housing and childcare. In fact, the average age for leaving the parental nest is 30 and the average age for women bearing their first child is 31, the oldest in the E.U. Life expectancy is high in Italy (85 for women; 81 for men). As a result, the median age in Italy is 45 (global median age is 31). Unlike South Korea, some of Italy’s population decline is offset by foreign residents who make up 9 percent of the population.
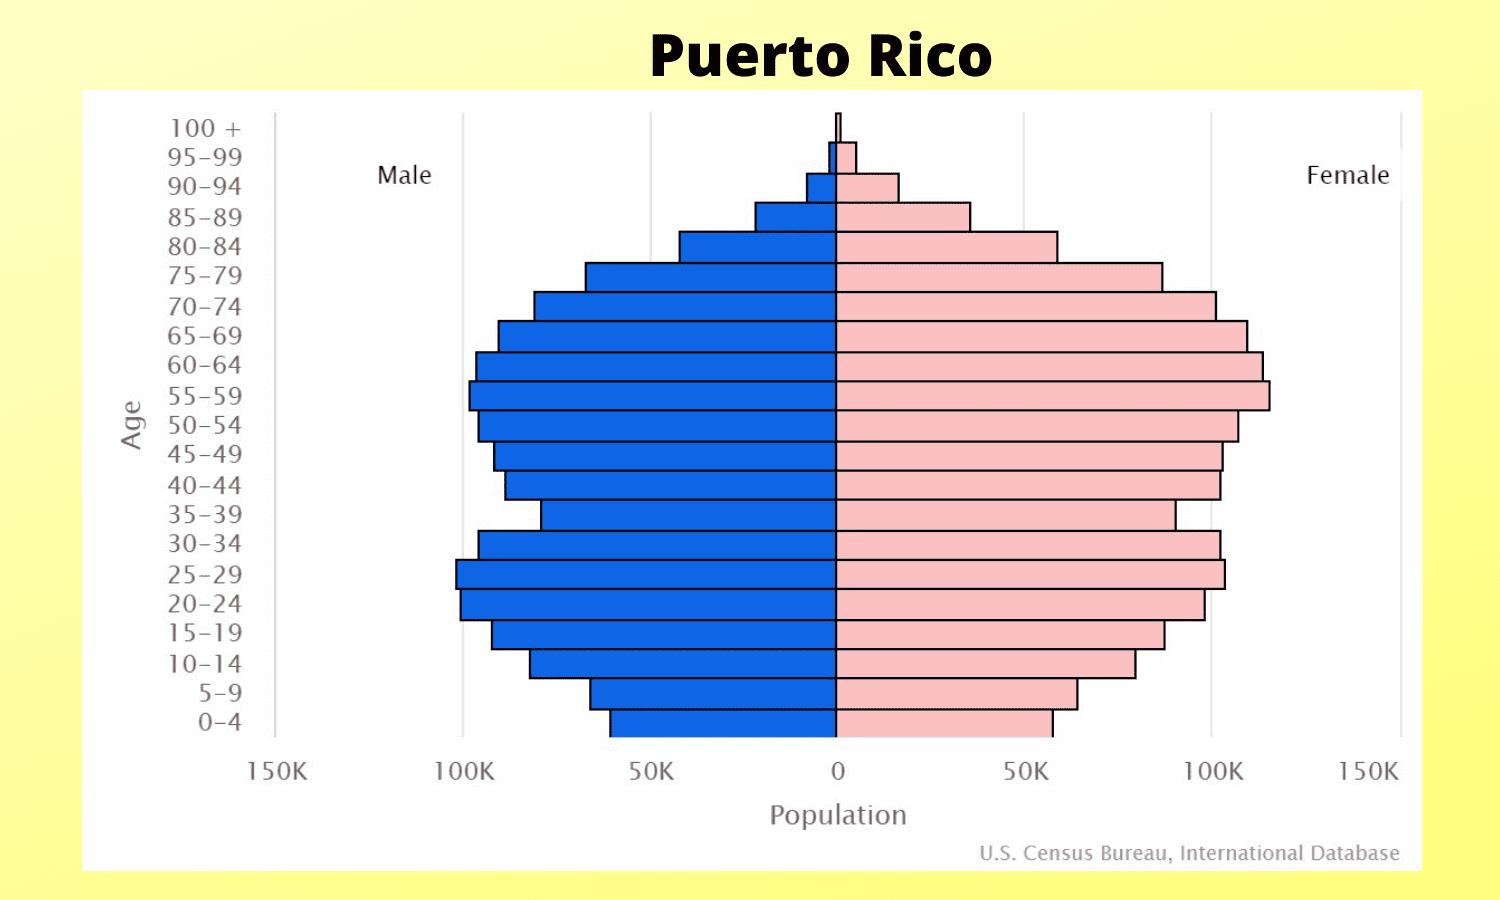
Puerto Rico’s Population Pyramid
Puerto Rico’s demographic structure has changed significantly in recent years, fueled by declining fertility rates and out-migration of young families moving to the mainland U.S. Some of this migration has occurred since Hurricane Maria devastated the island in 2017, but even before that (2009-2017), the island’s population dropped 12 percent, following fiscal crisis. The dwindling number of children has shuttered schools in Puerto Rico and pushed the median age on the island to 45 (compared to 38 on the mainland).
Implications for Top-Heavy Age Structures
This demographic structure of rapidly aging populations and low fertility rates has many implications for these regions including a smaller working-age population that could impact economic productivity and competitiveness. An aging population requires more services for senior residents such as health care and living assistance.
Italy’s overall population is already declining and South Korea’s population is expected to begin shrinking in a few years. Puerto Rico’s population has already declined by a quarter in the past 20 years.
Graph Comparisons in the Classroom
PopEd’s pyramid activities enable students to create age-sex distribution graphs for a variety of country structures and interpret the demographic trends they see. Both the middle and high school versions of Power of the Pyramids include examples of top-heavy graphs (for Germany and Japan respectively).