You may be aware of the ominous term “The Sixth Extinction,” used widely by biologists and popularized in the eponymous bestselling book by Elizabeth Kolbert. Essentially, we’re in the midst of a catastrophic loss of biodiversity. Scientists agree that the species die-offs we’re seeing are comparable only to 5 other major events in Earth’s history, including the famously nasty one that killed the dinosaurs. But how do we know that this isn’t just business as usual? In order to compare our current rate of extinction against the past, we use something called the background extinction rate.
Background extinction rate, or normal extinction rate, refers to the number of species that would be expected to go extinct over a period of time, based on non-anthropogenic (non-human) factors. The background extinction rate is often measured for a specific classification and over a particular period of time. For example, a high estimate is that 1 species of bird would be expected to go extinct every 400 years. Sometimes it’s given using the unit “millions of species years (MSY)” which refers to the number of extinctions expected per 10,000 species per 100 years.
 Scientists calculate background extinction using the fossil record to first count how many distinct species existed in a given time and place, and then to identify which ones went extinct. When using this method, they usually focus on the periods of calm in Earth’s geologic history—that is, the times in between the previous five mass extinctions.
Another way to look at it is based on average species lifespans. Extinction is a natural part of the evolutionary process, allowing for species turnover on Earth. Sometimes when new species are formed through natural selection, old ones go extinct due to competition or habitat changes. Basically, the species dies of old age. Scientists can estimate how long, on average, a species lasts from its origination to its extinction– again, through the fossil record. For example, mammals have an average species lifespan of 1 million years, although some mammal species have existed for over 10 million. Given these numbers, we’d expect one mammal to go extinct due to natural causes every 200 years on average—so 1 per 200 years is the background extinction rate for mammals, using this method of calculation. Instead, in just the past 400 years we’ve seen 89 mammalian extinctions. This is why scientists suspect these species are not dying of natural causes—humans have engaged in “foul play.”
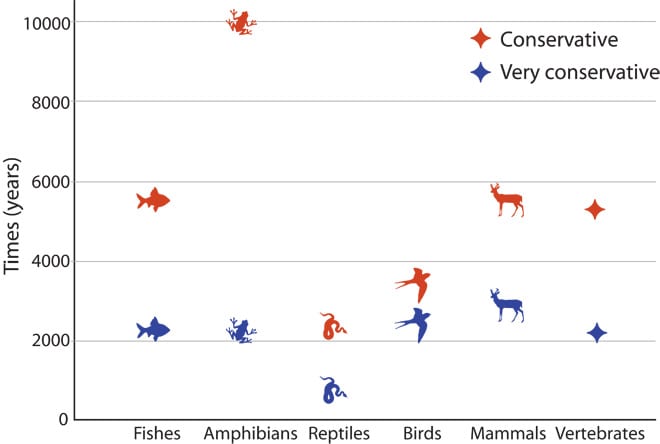
Number of years that would have been required for the observed vertebrate species extinctions in the last 114 years to occur under a background rate of 2 E/MSY.
At our current rate of extinction, we’ve seen significant losses over the past century. A recent study looked closely at observed vertebrate extinction data over the past 114 years. They then considered how long it would have taken for that many species to go extinct at the background rate. (A conservative estimate of background extinction rate for all vertebrate animals is 2 E/MSY, or 2 extinctions per 10,000 species per 100 years.) As you can see from the graph above, under normal conditions, it would have taken anywhere from 2,000 to 10,000 years for us to see the level of species loss observed in just the last 114 years.
This is why it’s so alarming—we are clearly not operating under normal conditions. To explore this and go deeper into the math behind extinction rates in a high school classroom, try our lesson The Sixth Extinction, part of our Biodiversity unit. And stay tuned for an additional post about calculating modern extinction rates.
Image credit: Extinction rate graph, Pievani, T. The sixth mass extinction: Anthropocene and the human impact on biodiversity. Rend. Fis. Acc. Lincei 25, 85–93 (2014). https://doi.org/10.1007/s12210-013-0258-9; Species loss graph, “Accelerated modern human-induced species losses: Entering the sixth mass extinction” by Gerardo Ceballos, Paul R. Ehrlich, Anthony D. Barnosky, Andrés García, Robert M. Pringle, and Todd M. Palmer. Science Advances, Volume 1(5):e1400254, 19 June 2015