The rate of natural increase (RNI) is a measure of how quickly a population is growing or declining. However, the RNI does not factor in population change resulting from immigration or emigration – it is determined solely by the difference between birth and death rates in a region. To calculate the RNI, demographers subtract the death rate (number of deaths per 1,000 people/year) from the birth rate (number of birth per 1,000 people/year) and convert the answer to a percentage.
Equation for Rate of Natural Increase (RNI)
(BirthRate/1,000) – (DeathRate/1000) = (BR-DR)/1000 = RNI %
Examples of Calculating RNI
Let’s look at a couple of examples. In Nicaragua, the birth rate is 20/1,000 and the death rate is 5/1,000. Following the formula for finding RNI…
20/1,000 (BR) – 5/1,000 (DR) = 15/1000
15 divided by 1,000 = 0.015 which when converted to a percentage equals 1.5%
So Nicaragua’s rate of natural increase is 1.5%.
An RNI percentage larger than zero indicates a growing population. In some countries, like Germany, the death rate is larger than the birth rate, which causes a negative percentage. In the case of Germany, the birth rate is 9/1,000 and death rate is 11/1,000, resulting in an RNI of -0.2%. A negative RNI indicates a decreasing population size.
However it’s important to remember that this growth rate does NOT account for change based on migration, which can have a significant impact on a country’s overall rate of population change.
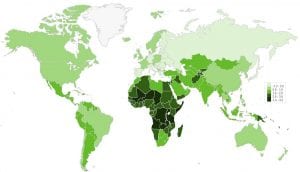
Rate of natural increase by country (2018)
Currently, Niger has the highest RNI, growing at 3.78%, and Bulgaria has the lowest, at -2.79%. The United States’ rate of natural increase is -0.65%.
Why Use RNI?
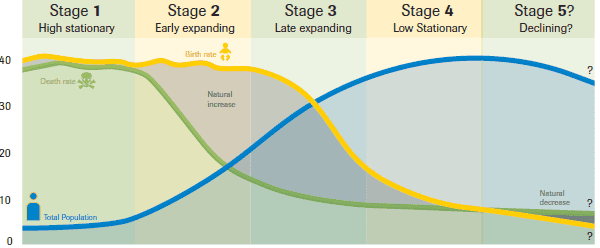
Because RNI is based only on birth and death rates, it can be used to help determine a country’s stage within the Demographic Transition Model (DTM). Countries that are still developing often lack the social and medical infrastructure that tend to keep birth rates low, and thus often have a much higher birth rate than death rate. This results in a higher RNI indicating more rapid population growth. Countries with these demographic characteristics – higher birth rate than death rate leading to rapid population growth – fall into the earlier stages of the Demographic Transition model. Countries with lower birth rates, perhaps nearly equal to their death rates, have a lower RNI and fall into the later stages of the DTM.
RNI is also often used by government groups or aid associations like the World Health Organization to determine the effectiveness of certain programs and policies aimed at decreasing birth or death rates.
Ideas for Teaching RNI in the Classroom
 Understanding RNI and how to calculate it is an essential part of demography and is important for students to consider as they grapple with the demographic challenges that lie ahead. What’s more, calculating RNI helps build math skills, while also applying learning to a real-world context. In our lesson plan Demographic Facts of Life (available in our Population Dynamics unit), high school students calculate RNI and the corresponding doubling time or half-life for several countries and explore factors that influence a country’s birth and death rates.
Image credits: Map of RNI (PRB)