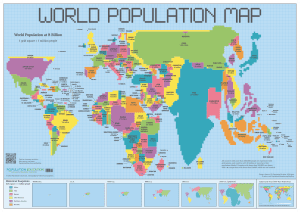
Now that the World Population Map is being distributed, we’ve heard from many educators who utilize population cartograms in the classroom. One such educator is Kyle Haddad-Fonda, today’s guest blogger. Kyle is the Director of Strategic Initiatives at the Nicholas Sparks Foundation, a non-profit organization devoted to increasing access to global learning opportunities for students.
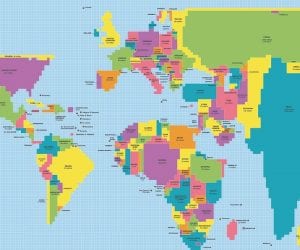
There are few sights more heartening than that of an elementary school whose classrooms and hallways are decorated with world maps. Yet teachers should be careful to make sure that the standard depiction of the world map is not the only map their students encounter. Otherwise, they run the risk that children will assume “this is the way the world looks,” rather than the more complicated reality that “this is one of many ways of representing our world.” One useful antidote to this way of thinking is for students to explore cartograms, which are maps that use the relative area of places to present statistical data.
I first started teaching population cartograms to second graders in spring 2004, during my junior year of high school. It was the second lesson of the fourth iteration of my after-school geography class at a school in suburban Seattle, where I had once attended second grade myself. I had a room full of students who were eager to learn about the world and, accordingly, I wanted to devise a lesson that would challenge them to view the world in a new way.
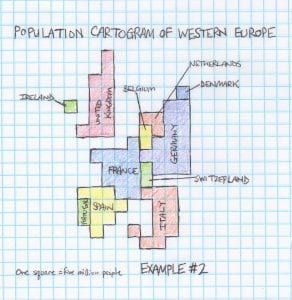
I gave each student a piece of graph paper and a card indicating the number of squares that each country in Western Europe would have to occupy on their cartogram. I scaled the maps so each square on the graph paper would represent about five million people. Germany, which was then home to about 83 million people, required 17 squares. Denmark needed only one square, while tiny Luxembourg had too small a population to make the map at all. By eliminating the need for second graders to do the math necessary to calculate these values, the exercise focused solely on the sizes, shapes and positions of each country. The goal was for the students to try to make France look like France and to make Germany look like Germany—even though Germany is larger in population and smaller in area.
One of the brightest of my students immediately identified a crucial decision he would have to make: should he try to include islands on his map? Specifically, he needed to determine whether to place one of the United Kingdom’s 13 squares next to Ireland to denote Northern Ireland and whether to include the islands of Sicily, Sardinia, and Corsica. I discussed with him the pros and cons of each possibility and left it up to him to decide whether to be more faithful to the shape of the countries or the actual distributions of their population. In the end, he left all the islands off his cartogram. A girl at the same table, perhaps hoping to be contrarian, or perhaps hoping to exhibit more artistic skill than her tablemate, meticulously added all three Mediterranean islands to hers.
The most important lesson to take away from such an exercise was for my students to understand that all these ways of illustrating the relative populations of Western Europe were equally valid. No two students produced identical cartograms, and yet they had all constructed their maps correctly. The most wonderful thing about map making is that there is almost never a single right way to do it. Over the past decade, as I have made cartograms with more and more students, I have relished seeing their eyes light up as they begin to embrace the complexities and ambiguities of geography, and I have become only more earnest in my conviction it is crucial to teach students from the youngest possible age that so much of how we view our world is in the eye of the beholder.
Lesson Plans: Please check out the many lesson plans on the resources page of the Nicholas Sparks Foundation for more teaching ideas.