Resource Overview
Using the methods of a demographer, students will analyze, interpret, and evaluate conclusions on population data from the World Population Map, and then construct their own population cartogram.
Students will be able to:
- Identify, explain, and interpret population data from a cartogram.
- Construct a population cartogram representing six world regions.
- Compare a population cartogram with an equal area land map.
- Evaluate how population cartograms influence perspective of geographic regions.
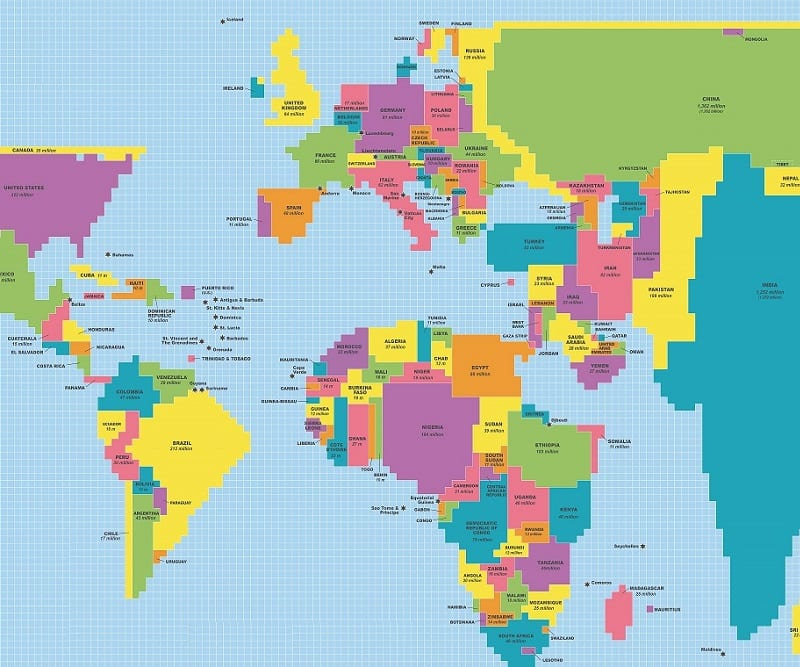
This lesson plan should be used with the World Population Map, a population cartogram.
Features of This Resource
- Students interpret a cartogram of global population
- How do population cartograms influence one’s perspective of geographic regions?
Supplemental Materials
How Do I Get This Lesson Plan?
The resource is free. Click the green button for immediate download. Download Now
Other Resources You Might Like:

Students experience the changing pace of population growth by actively simulating the Earth’s population growth over a 500-year span. Students... Read more »
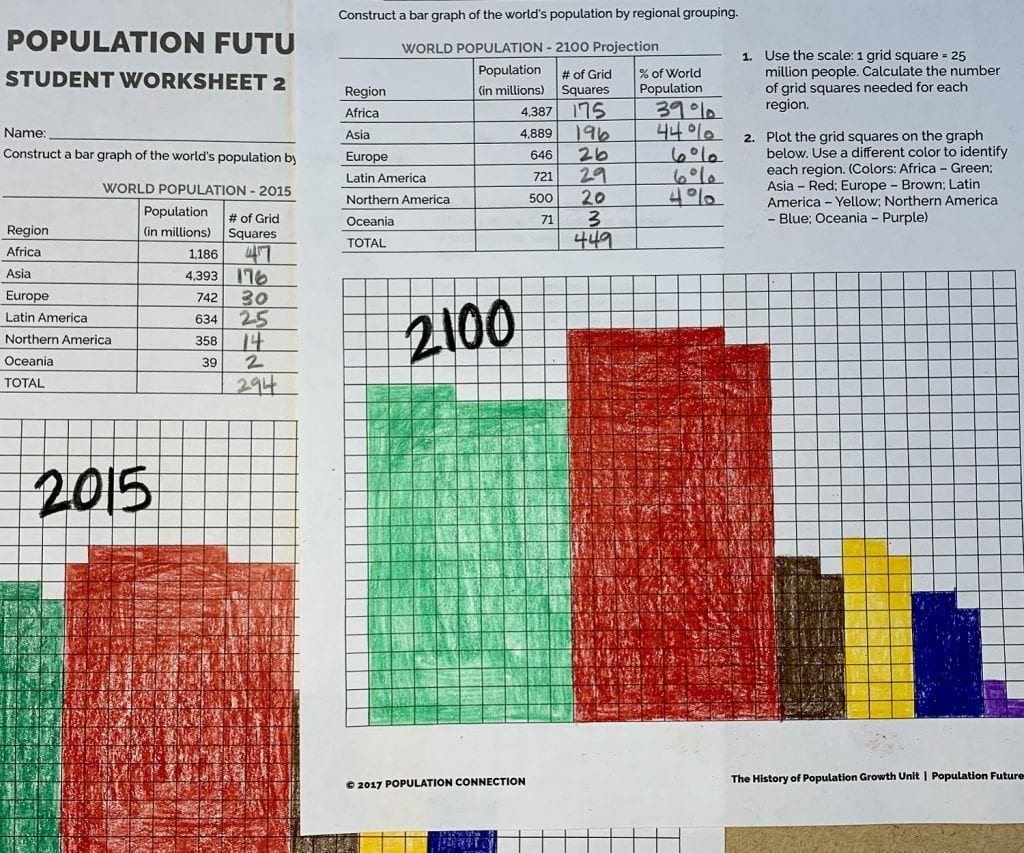
Students interpret a graph showing global population projections through 2100, then create gridded bar graphs to represent the relative size... Read more »

Students use real-world data to construct and interpret population pyramids and discuss differences in population growth rates among several different... Read more »
Nice to meet you!
Tell us a bit about yourself so we can continue creating resources that meet your needs.
You’ll only need to fill out this form once. If you’ve already completed the form, you can confirm your email here.