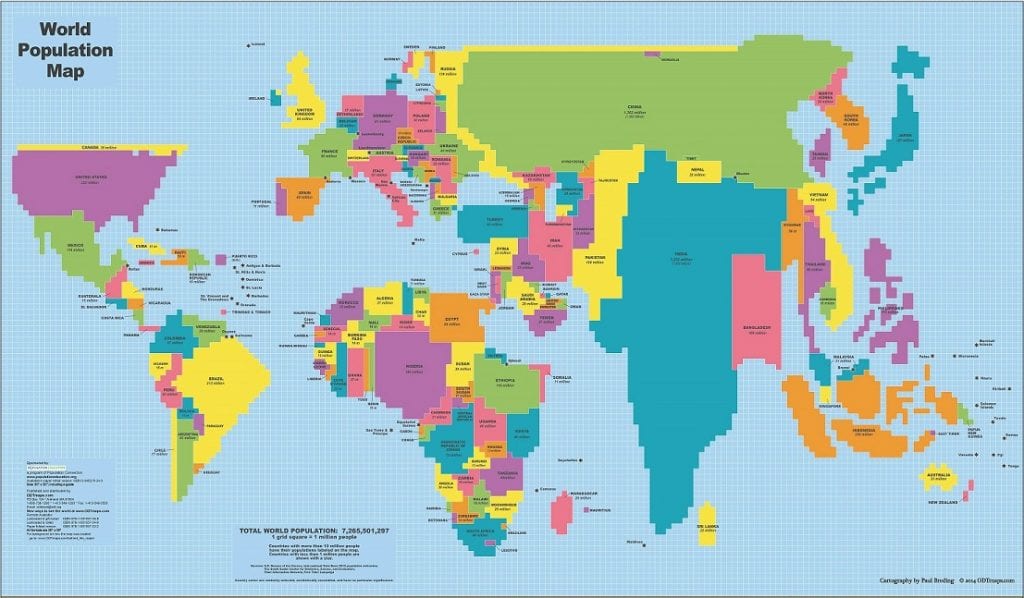
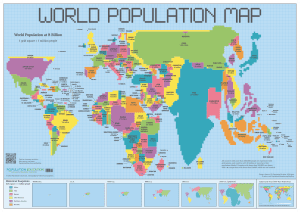
Cartograms are fun, but even more so they provide access points for student learning and engagement across the K-12 spectrum. And while they appear simple, hidden within every cartogram is a human element to their design. The mapmaker’s choices complicate how the cartogram should be interpreted and raises questions like: Why doesn’t the same dataset produce identical maps? Why did the map maker choose to preserve some geographic features over others? When this complexity is teased out and made apparent to students, the true value of cartograms comes alive – challenging how we construct our view of the world. In order to reach that higher level understanding, students first need to develop the necessary geography and geo-literacy skills for constructing and interpreting cartograms.

Building Geography Skills for Elementary Students with Cartograms
For elementary-aged learners the goal may be to increase their ability to identify properties of geographic representations (e.g., describing the key or legend) or to increase their exposure to various types of maps. Political, physical and even topographic maps are often the basis for a student’s own mental map of the world and cartograms will complicate these developing mental maps. Will it be challenging for your young students and uncomfortable at times – maybe. But it will ultimately strengthen their ability comprehend geographic data when presented in alternative forms, preparing students to better evaluate the complexities of the world in which they live.
In addition to the important content, there is an opportunity for students to learn new skills and practice existing abilities. By constructing a basic cartogram – whether an area cartogram of their neighborhood’s demographics or a distance cartogram of the local transit system – students will strengthen their mental mapping skills while better understanding the maps themselves. And with continuous advances in geographic information system (GIS) software even elementary students have the opportunity to construct cartograms that further develop their competency in geospatial technologies. As students create their own cartograms they will observe that although the same data was used by all, none of their cartograms are identical, but all are valid when complete.
Building Secondary Student’s Geo-literacy Skills with Cartograms
When evaluating a cartogram, secondary students can delve into questions that go beyond, “What geographic features did the map maker choose to preserve?” into higher-order analysis of, “Why did the map maker choose to preserve some features over others? How is the data manipulated by his or her understanding of the geospatial context? How does the completed cartogram challenge or reinforce individual understandings of the mapped area?” There is so much complexity within the design of cartograms – being built from one part statistical data and one part imagination – that inquiry never really ends and students are forced to work with a level of ambiguity. Having students critically evaluate the construction behind the cartogram adds another layer to their geographic reasoning. Maps are assumed to be tools for clarifying information but through this lens of inquiry they can end up creating more questions than answers. Comprehending the data is a difficult task because cartograms demand not only geo-literacy but also quantitative literacy. At the secondary level cartograms are a great way to transfer skills and concepts from mathematics into aiding understanding of real-world situations that are the topics of social studies.
And if you need more convincing that cartograms are an effective classroom tool, keep in mind that the skills highlighted here align with the National Geography Standards Index as well as the 21st Century Skills Map for Geography. So regardless of when cartograms are used in K-12 education, they are a wonderful addition to any social studies curriculum.


