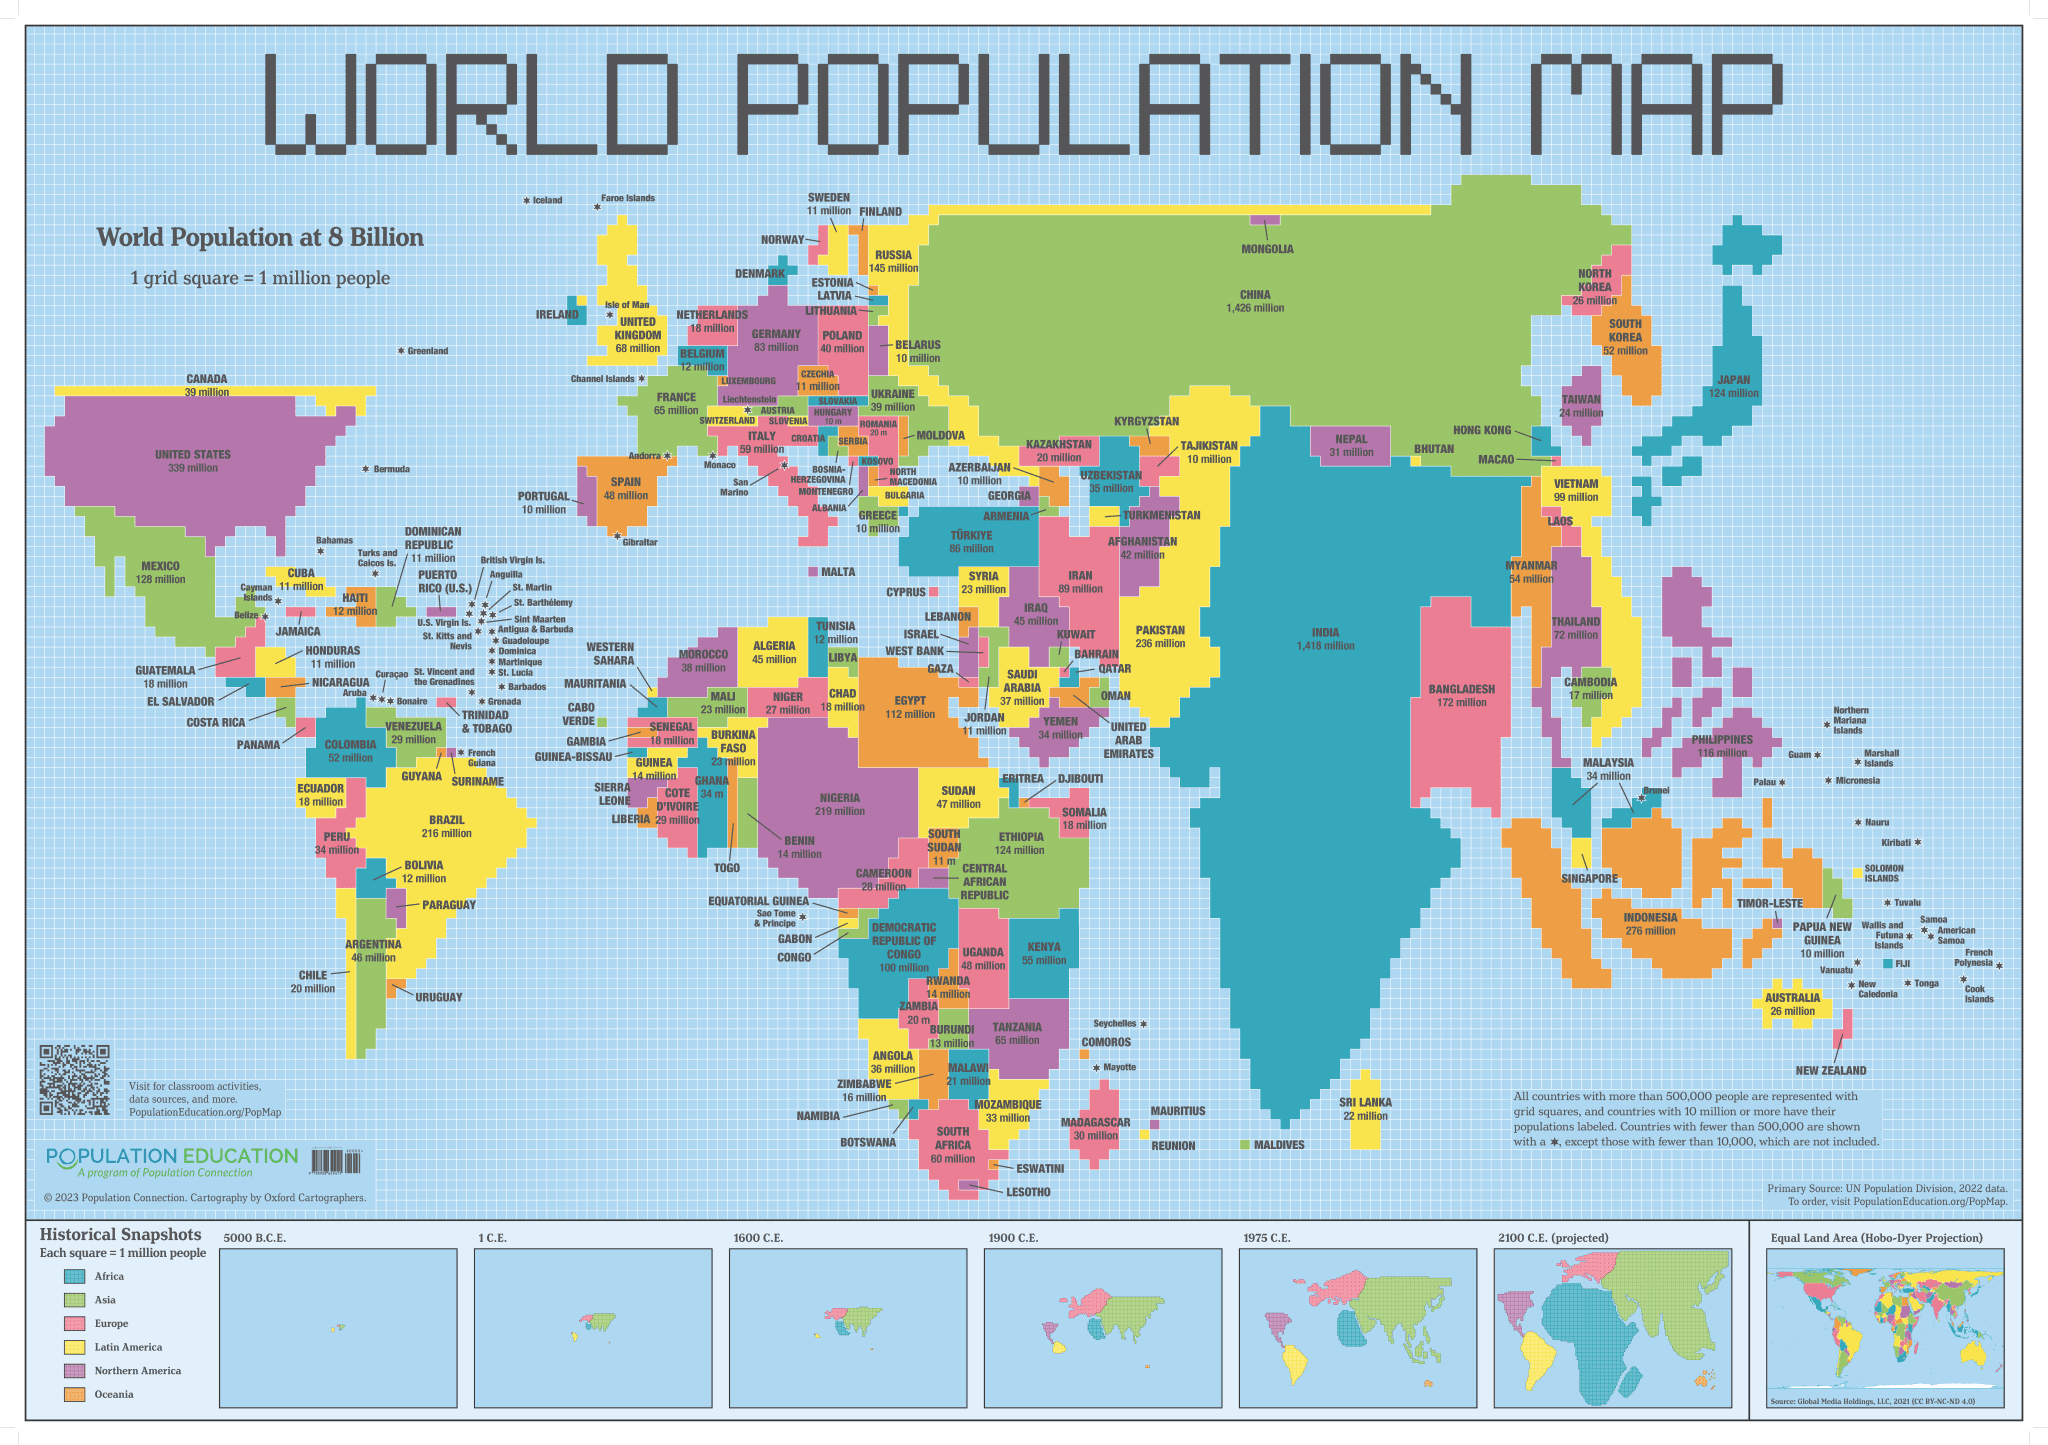
The World Population Map poster and a set of classroom activities are available now to spark students’ interest in exploring global demographics and human development.
The colorful, classroom-size population cartogram provides a unique view of the earth – the size of each country is shown in proportion to its population, rather than its land mass. As such, it is a powerful tool for exploring how population data can be visually represented and how different map types can alter perspectives of how one sees the world.
Featuring a student reading and two classroom lesson plans, the World Population Map Activity Guide uses the map as a launch pad for student exploration into the trends that effect population size and change. Through analysis, quantitative research, and argumentative writing, students come to understand representations of complex data and how the data sheds light on the lives people around the world. The activities have been designed primarily for the high school social studies classroom but are all interdisciplinary, relying on and applying knowledge and skills from mathematics, English language arts, and science.
The C3 Framework for State Social Studies was used to guide the development of the Activity Guide. The lesson plans apply the Disciplinary Concepts and Tools for Geography, while emphasizing skills in questioning, developing explanations, and communicating conclusions. A list of academic vocabulary is provided and terms are utilized throughout the lessons.


