You’re visiting a new city and just learned of an ice cream festival happening today. While you have the address, you don’t know the location in relation to your hotel. (And let’s assume your cell phone fell into a swirling vat of ice cream at the last festival you attended, so no GPS navigation systems for you!) Is the festival too far to walk? How will you get there? To help you make a decision, you look at a map, locate the ice cream festival’s address, and compare it your hotel. What you just did was use a tool to help you visualize something too large to see with the eye, and it provided you with helpful information. The map served as a model.
Now you might be thinking, isn’t a model supposed to cover something more complex? A phenomenon, or even a concept or idea? What you’re thinking of here is a scientific model. And true, a map doesn’t fit the bill.
Nonetheless, maps are informative representations. They’re more on par with scale models, like the mini plastic seaplane you might have built as a kid. Both maps and scale models provide an accurate representation of something in a way that is more digestible, easier to see as a whole, or user-friendly.
But I’d argue maps go even further than the direct representation. Here are three examples of maps as models – instances where the map offers not just a representation but a unique perspective of the information it portrays.
Cartograms as Informative Models
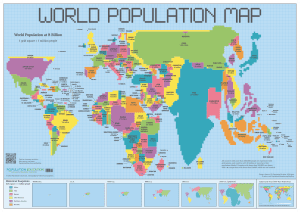
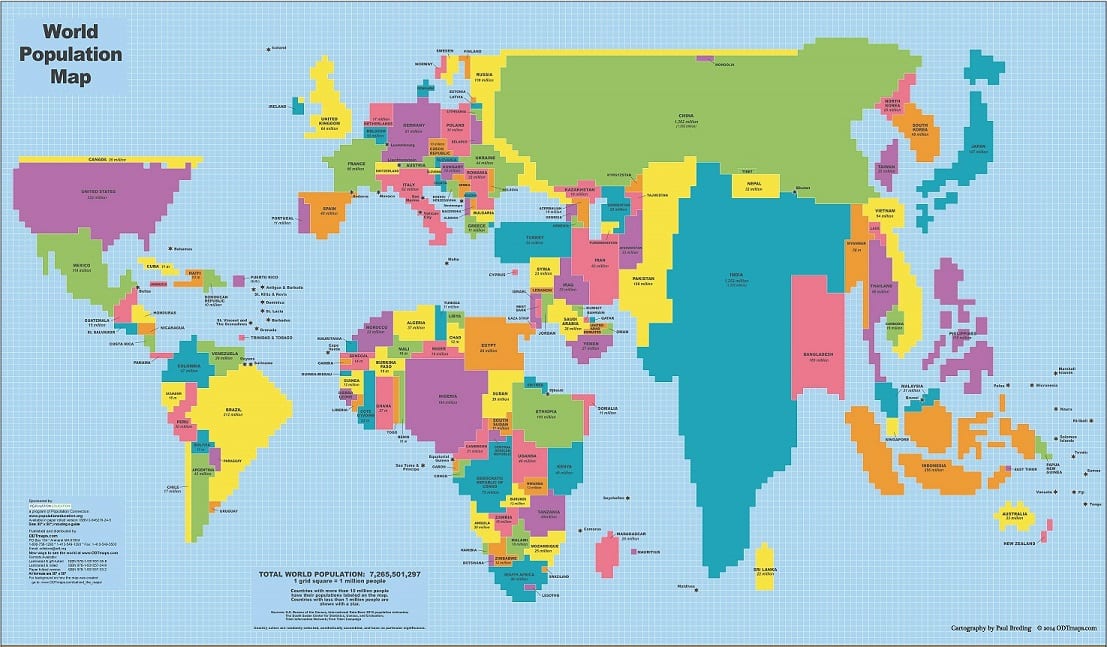
A cartogram is a map in which each area is proportionally sized according to some particular characteristic. A population cartogram, like the one pictured here, shows the relative size of different countries’ populations on a world map according to a set scale. The larger the population, the larger the country on the map.
Layered Maps (or Map Overlays) Model Multiple Data Sets
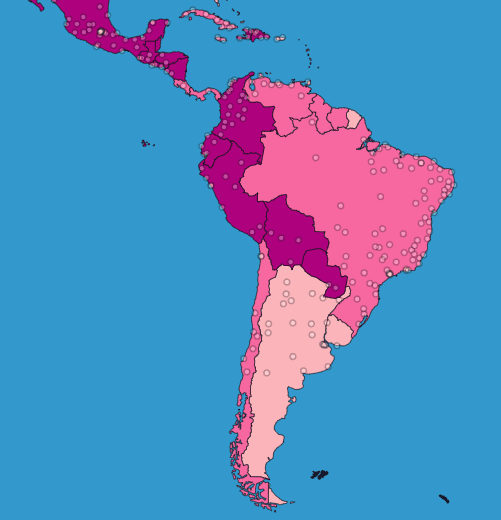
A layered map portrays separate pieces of information, directly on top of the other and tied to specific geographic locations. By doing so, the viewer can easily compare different attributes that occur in the same space. Take the map below where the white circles show population density (each dot represents 1 million people) and the shades of pink show country-level fertility rates (the darker the shade, the higher the rate).
Choropleth Maps as Geographic Models
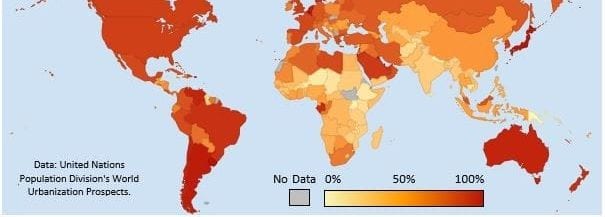
On a choropleth map, geographic units (a country, state, etc.) are filled in using a color gradient or with patterns, to display numerical data. Each color or pattern represents a value, or range of values. Choropleth maps are a helpful way to investigate data across regions and allow for comparisons of the data. Here we see a choropleth map showing global urbanization rates with an orange gradient. The light yellow shows very low urbanization and the burnt orange very high urbanization levels.
Yes, A Map is a Model
Maps shape our view of the world by helping us better understand it.
They are informative representations that can also help us visualize something that is too large to see with the eye. And some maps even provide a unique perspective of the information at hand. The three maps above can all be used as tools for discovery by giving people a new way of visualizing data. Given all of these characteristics, it is certainly fair to say that a map is a model.