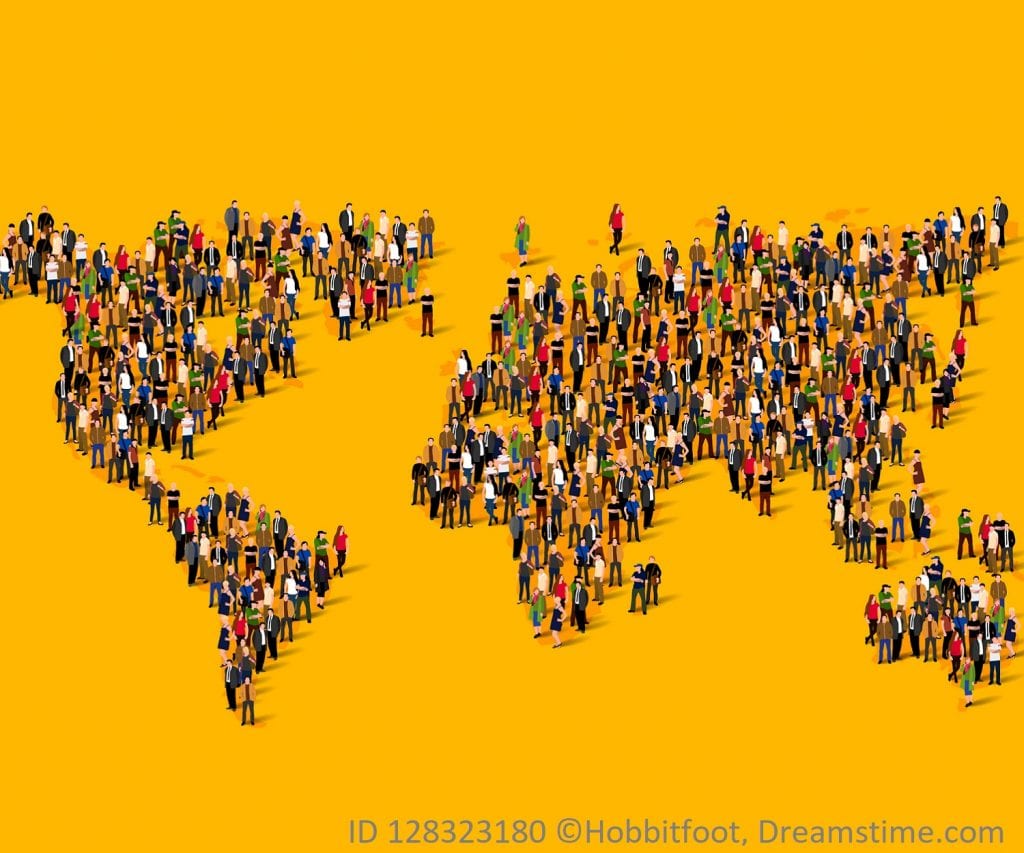
Resource Overview
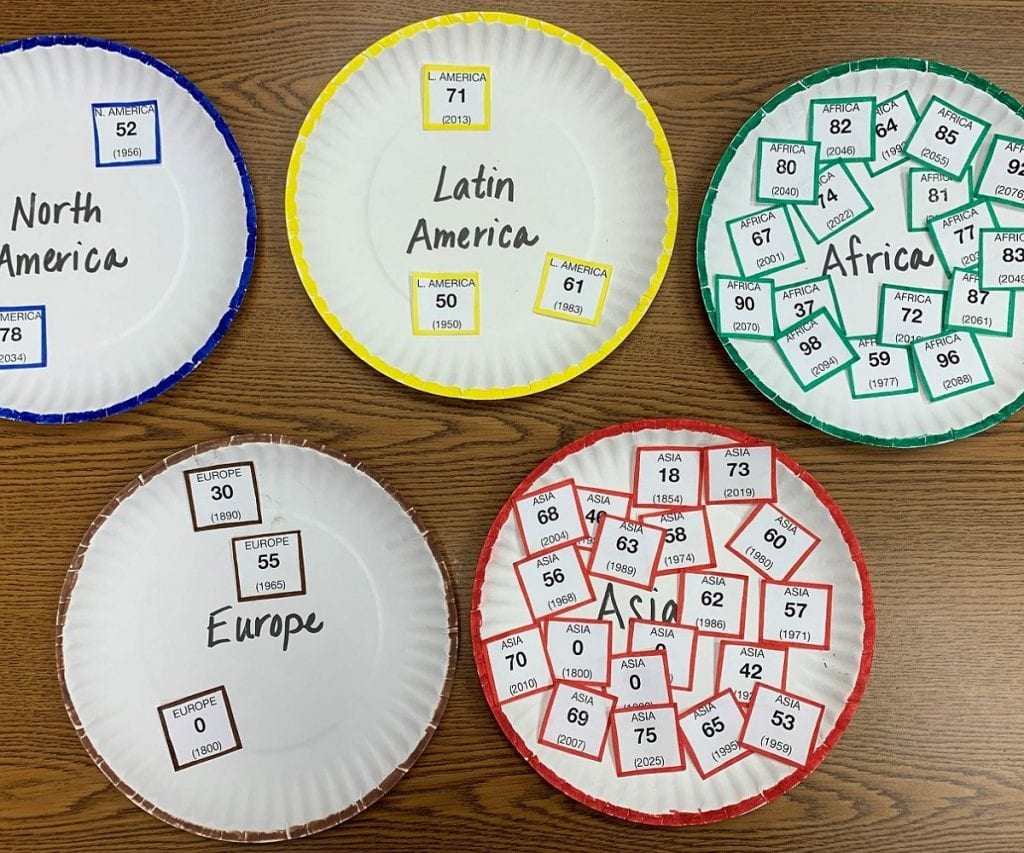
Students interpret a graph showing global population projections through 2100, then create gridded bar graphs to represent the relative size of different regions’ populations for different years (past and future).
Students will be able to:
- Interpret a population projections graph.
- Describe factors that affect fertility and mortality trends.
- Create bar graphs to represent the population sizes of different world regions over time.
- Draw correlations among different pieces of demographic data to help explain population trends in different world regions.
- Define demographic terms including fertility rate, infant mortality rate and life expectancy.
Features of This Resource
- Drawing correlations among data historic data
- Identifying trends and patterns between time periods
- Unique way of visualizing population data – as area on a grid
How Do I Get This Lesson Plan?
The resource is free. Click the green button for immediate download. Download Now
Other Resources You Might Like:

Students use real-world data to construct and interpret population pyramids and discuss differences in population growth rates among several different... Read more »
Acting as residents of five major world regions, students compare various statistics that affect people’s health and well-being. Students will... Read more »
Students discuss the UN’s population projections to explore how small changes in the fertility rate can produce significantly different future... Read more »
Nice to meet you!
Tell us a bit about yourself so we can continue creating resources that meet your needs.
You’ll only need to fill out this form once. If you’ve already completed the form, you can confirm your email here.