Last Thanksgiving we shared a Water Footprint Calculator to help you determine how much water went into your Thanksgiving feast, and here we follow-up that post by exploring what exactly a water footprint is, why water footprints matter, and how you can explore water footprints with your students.
 Every day we use a variety of products without thinking about the environmental impact. Behind every cup of coffee stretches a long line of resources to get the cup into our hands. Water makes up a large part of a product’s resources, and an item’s water footprint can be surprisingly large.
What is a Water Footprint?
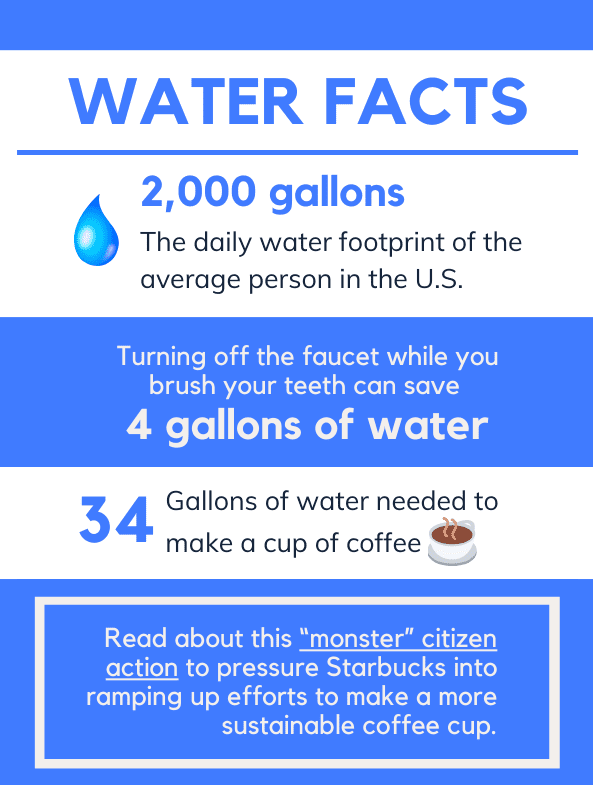
A water footprint refers to the estimated amount of water needed to create a product and to get it into the hands of consumers. Some water is visible and easy to measure. An 8-ounce cup of coffee needs about 8 ounces of water to make the drink. Some water is less visible and less obvious. It takes hundreds of gallons of water to grow the coffee plant from a seed to maturity, to process the wood pulp that becomes the paper coffee cup, and to pump the petroleum that becomes the gas that transports the coffee to your hands. The hidden water footprint can add up quickly, and this means that everyday items can have an out-size impact on the world around us.
To understand more about the implications of water footprinting, let’s break down the definition a bit further:
In 2002, a Dutch researcher named Arjen Hoekstra formalized the concept of a water footprint as a way to measure the amount consumed and polluted in a product’s supply chain. He then created the Water Footprint Network to share his research and build towards a goal of sustainable global water use. Hoekstra’s total water footprint includes three components: green water, blue water, and grey water.
What is Green Water?
Green water refers to the moisture normally present in the environment where the plant grows. For our coffee plant, this includes rainwater as well as moisture naturally occurring in the soil. Some of this green water is absorbed by the plant, some evaporates before the plant uses it, and some is used and then transpired (released) from the plant.
What is Blue Water?
Blue water includes all of the water added to the plant which wouldn’t be present without the help of human farmers. This includes water diverted through irrigation systems from streams, rivers, aquifers, and lakes into our coffee field. Blue water encompasses the water that makes it into the plant, as well as what evaporates before the plant takes it in, and what gets returned to streams, lakes and aquifers without the plant using it.
What is Grey Water?
Grey water is the volume of water impacted by agricultural processes. Sometimes chemicals like pesticides and fungicides wash off coffee plants and travel into local streams, lakes, and aquifers. The grey water footprint is the amount of water needed to dilute those chemicals to safe levels in the environment.
Why Do Water Footprints Matter?
Our consumption choices have a global impact. In today’s world, products travel thousands of miles to reach the consumer. A purchasing decision in Virginia can impact a coffee farmer in Vietnam, a forest in China that’s harvested for paper pulp for cups, and a community downstream from a petroleum plant in Mexico where gasoline is processed. And not all countries maintain quality environmental regulations for agricultural practices, resource extraction, and industrial processes, including our own country.
Exploring Water Footprints in the Classroom
It’s important to be aware how our individual choices can impact the world around us. Several PopEd resources can help you explore your own personal water footprint, and help guide your students’ exploration of their own impacts.
- Meat of the Matter: In this middle school lesson, students compare the water, land and greenhouse gas footprints for four different types of protein. This lesson uses water footprinting data from the Hoekstra study. Spoiler alert: some meat has a surprisingly large water footprint.
- Water, Water Everywhere: Secondary students start by viewing a demonstration of all water on the planet, noting what percentage represents available freshwater to feed our global family. Then students do a water audit in their own lives. This lesson includes a digital tool for conducting an audit in a virtual classroom.
- Thanksgiving Meal Calculator: Calculate the specific water footprint of your own unique recipe or menu using this calculator. The downloadable Excel spreadsheet converts water footprinting data from Hoekstra’s study into quantities that the home chef will recognize. The spreadsheet includes over 100 ingredients from around the world organized like a shopping list.
- Secret Life of Stuff: While not focused solely on water footprints, this lesson guides students through a Life Cycle Analysis of a common, everyday object. It will help students understand some of the hidden costs (like water, electricity, pollutants, labor practices, and more) behind stuff we use every day.
It’s also important to explore ways to work together for bigger changes. Not only do individuals need to be aware of their own purchasing power, but governments and organizations around the world need to be held accountable for regulations and practices at all stages of the supply chain. Students can become a global change-maker using our Teen Activism Toolkit, with suggestions for taking action on issues important to them.
Finally, let students put their water activism work on an international stage: the World of 7 Billion Student Video Competition kicks off next school year. Students create a 1-minute video linking population growth to one of three topics and suggest a sustainable solution. One of this year’s topics is agriculture, making a perfect platform for students to share ideas for sustainable water use in agriculture that can lower the footprint of coffee and many other items we use every day.