Lesson Plan
Grades 6-8
Every Picture Tells a Story
Resource Overview
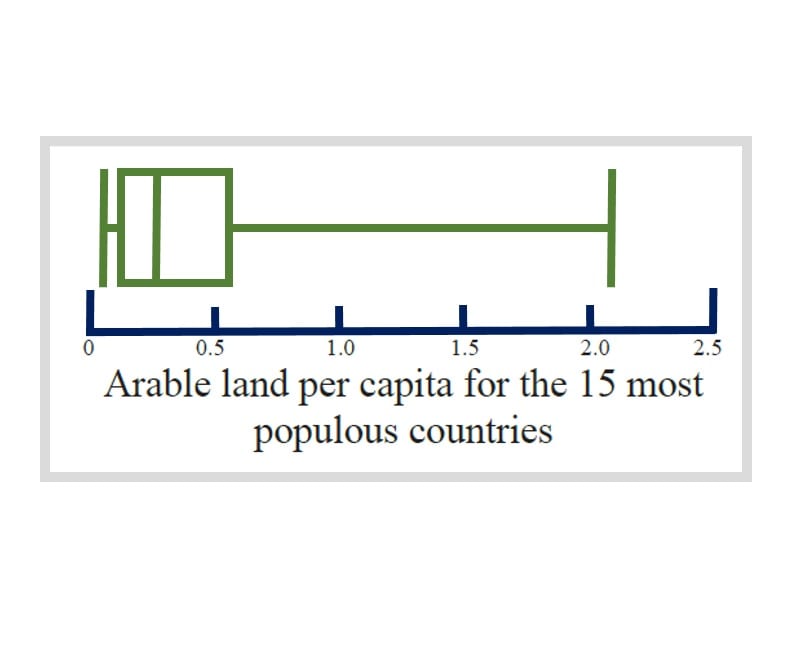
Students graph data on international demographics, environmental trends and indicators of human well-being using box plots, stem-and-leaf plots, scatterplots, histograms, and other methods.
How Do I Get This Lesson Plan?
Other Resources You Might Like:

Students simulate the Earth’s population growth over a 500 year span and then create a timeline that visually depicts population... Read more »
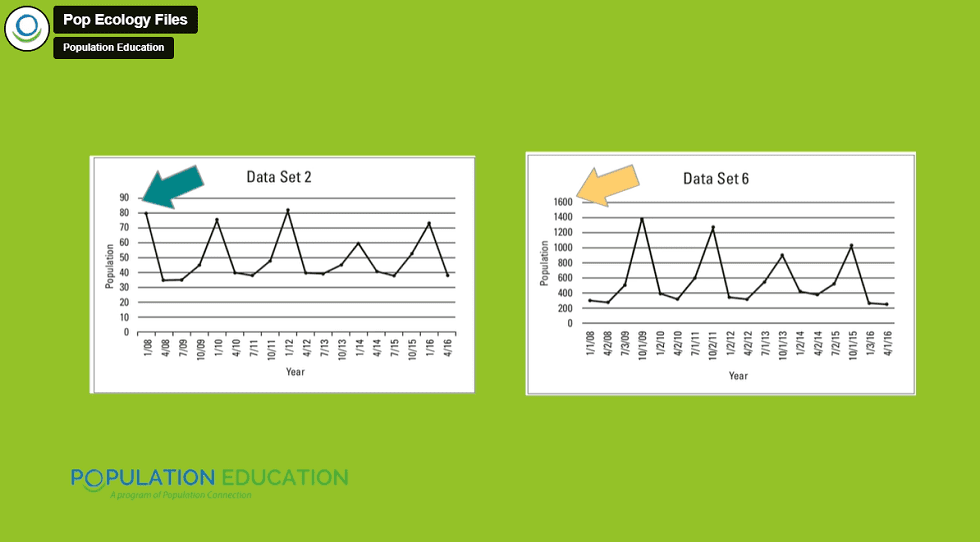
This interactive biology and ecology activity engages students in graphing and analyzing population growth curves for six mystery species and... Read more »
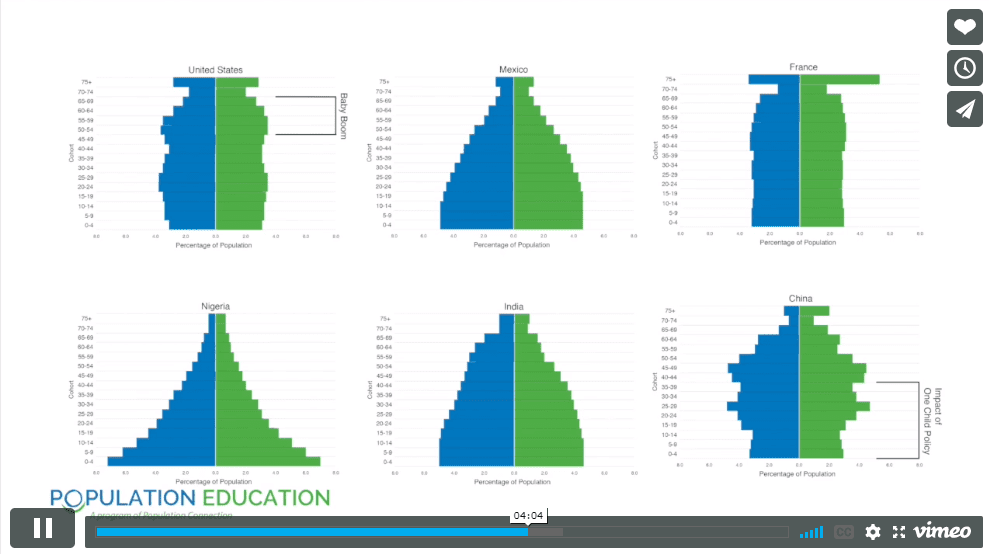
Students construct and interpret population pyramids for six different countries in this lesson. By analyzing age and sex distribution, they... Read more »
Nice to meet you!
Tell us a bit about yourself so we can continue creating resources that meet your needs.
You’ll only need to fill out this form once. If you’ve already completed the form, you can confirm your email here.