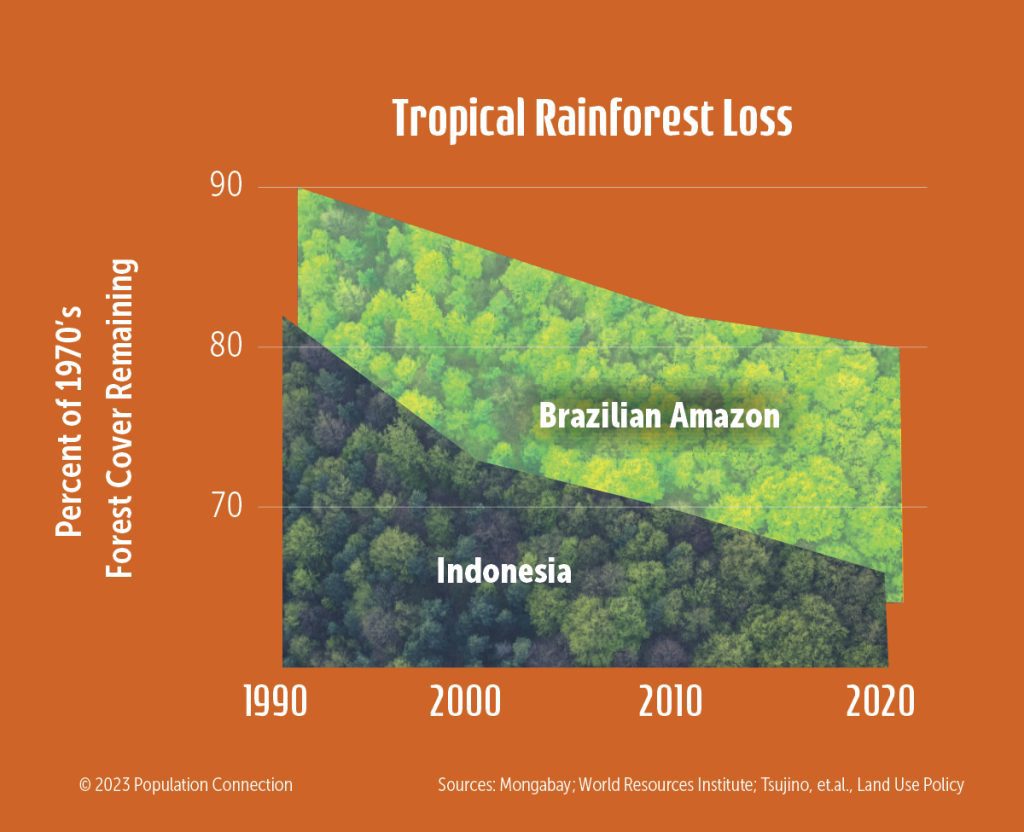
Line graphs of tropical rainforest loss. Graphs display forest loss in Indonesia and the Brazilian Amazon, showing the percentage of 1970s forest cover remaining in 1990 compared to 2020.
Tropical forest data is from Mongabay, the World Resources Institute, and Tsujino et.al. in Land Use Policy.
Graphic originally published on the Quick Trip to 8 Billion wall chart.
Other Resources You Might Like:

Land use background reading: As population grows, we develop wild areas and arable land and overuse resources like soil, minerals,... Read more »

Through a small group simulation using probability, students explore how different population growth rates are impacting biodiversity levels. Students will... Read more »

Acting as different stakeholders with various interests, students play a strategy game where they work in groups to negotiate management... Read more »
Nice to meet you!
Tell us a bit about yourself so we can continue creating resources that meet your needs.
You’ll only need to fill out this form once. If you’ve already completed the form, you can confirm your email here.