Resource Overview
Students graph carbon dioxide emissions and population growth over time and discuss trends they observe.
Students will be able to:
- Graph population and carbon dioxide emissions data over time.
- Identify the relationship between population growth and carbon dioxide emissions.

Features of This Resource
- Opportunity for authentic learning with real-world data
- Students create electronic graphs using Excel
- Historic data sets provided on CO2 emissions and global population
- Students differentiate between correlation and causation
How Do I Get This Lesson Plan?
The resource is free. Click the green button for immediate download. Download Now
Other Resources You Might Like:

By taking on the role of a community member, students analyze how energy poverty impacts people living in Monrovia, Liberia... Read more »

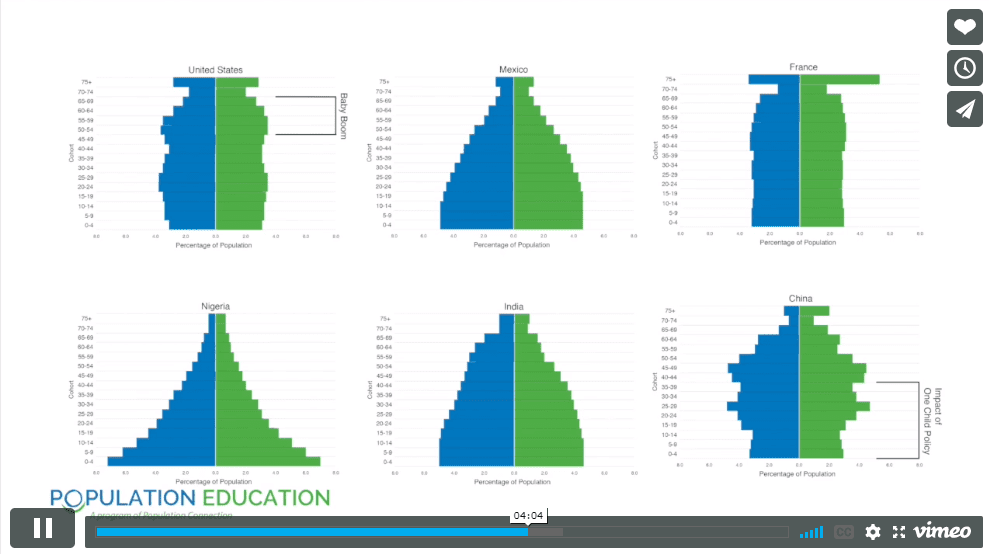
Students construct and interpret population pyramids for six different countries in this lesson. By analyzing age and sex distribution, they... Read more »

Through graphing and guided questioning students examine the cause and effect relationship between human activities and methane production. They then... Read more »
Nice to meet you!
Tell us a bit about yourself so we can continue creating resources that meet your needs.
You’ll only need to fill out this form once. If you’ve already completed the form, you can confirm your email here.


